Copyright
©The Author(s) 2016.
World J Radiol. Feb 28, 2016; 8(2): 183-191
Published online Feb 28, 2016. doi: 10.4329/wjr.v8.i2.183
Published online Feb 28, 2016. doi: 10.4329/wjr.v8.i2.183
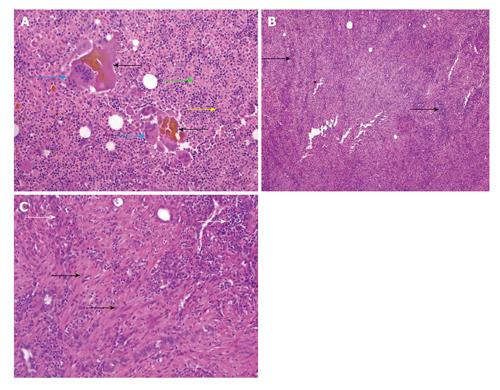
Figure 1 High power and low power view.
A: High power (HE, 200 ×) view showing inspissated bile (black arrows) with giant cells (blue arrows) in the vicinity. Green arrows denote histiocytes while the yellow arrows denote lymphoid cells; B: Low power (HE, 40 ×) view showing sheets of lympho-histiocytes in the gallbladder wall; C: High power (HE, 200 ×) view showing myofibroblasts (black arrows) with inflammatory cells (white arrows).
- Citation: Singh VP, Rajesh S, Bihari C, Desai SN, Pargewar SS, Arora A. Xanthogranulomatous cholecystitis: What every radiologist should know. World J Radiol 2016; 8(2): 183-191
- URL: https://www.wjgnet.com/1949-8470/full/v8/i2/183.htm
- DOI: https://dx.doi.org/10.4329/wjr.v8.i2.183


