Copyright
©The Author(s) 2016.
World J Radiol. Feb 28, 2016; 8(2): 174-182
Published online Feb 28, 2016. doi: 10.4329/wjr.v8.i2.174
Published online Feb 28, 2016. doi: 10.4329/wjr.v8.i2.174
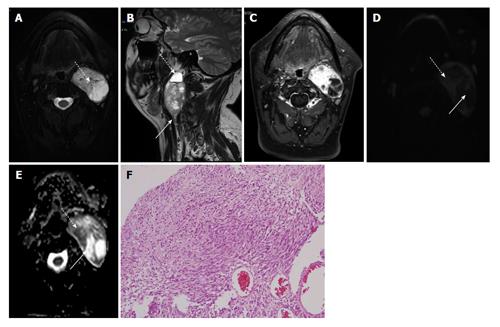
Figure 2 Left parapharyngeal space nerve sheath tumour in a 35-year-old lady.
A: Axial T2W FS image shows multiple intensely T2 hyperintense areas within suggestive of cystic degeneration (dashed arrow); B: Sagittal T2W image shows blood fluid level within the cystic areas (dashed arrow) along with thickened distal exiting nerve (solid arrow); C: Axial T1W FS post contrast image shows intense enhancement in solid areas of the mass while cystic areas are hypointense; D and E: DWI at b1000 (D) s/mm² and ADC map (E) show restricted diffusion in solid areas of the mass (dashed arrow) while cystic areas show free diffusion (solid arrows); F: Photomicrograph shows alternating hypercellular (Antoni A) and hypocellular (Antoni B) areas (H-E; original magnification: × 100). DWI: Diffusion weighted imaging; ADC: Apparent diffusion coefficient.
- Citation: Das A, Bhalla AS, Sharma R, Kumar A, Sharma M, Gamanagatti S, Thakar A, Sharma S. Benign neck masses showing restricted diffusion: Is there a histological basis for discordant behavior? World J Radiol 2016; 8(2): 174-182
- URL: https://www.wjgnet.com/1949-8470/full/v8/i2/174.htm
- DOI: https://dx.doi.org/10.4329/wjr.v8.i2.174


