Copyright
©The Author(s) 2016.
World J Radiol. Nov 28, 2016; 8(11): 868-879
Published online Nov 28, 2016. doi: 10.4329/wjr.v8.i11.868
Published online Nov 28, 2016. doi: 10.4329/wjr.v8.i11.868
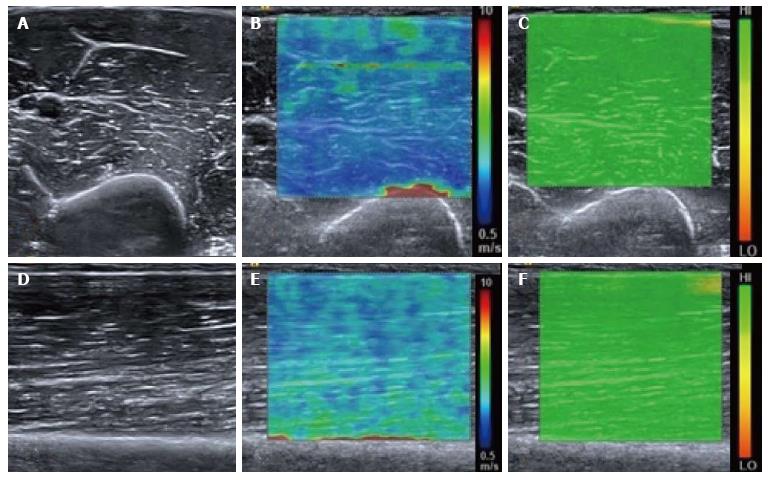
Figure 1 Normal relaxed biceps brachii muscle.
B mode transverse image of the mid biceps brachii muscle (A) with the corresponding shear wave elastography image (B) showing the shear wave velocity distribution. The velocity map is coloured such that blue represents the slowest waves and red the fastest, illustrated by the scale. Note the fast (red colour) shear waves at the interface with the hard humeral bone. A range of shear wave velocities are seen at the fascial interfaces within the muscle belly. The upper right image (C) shows the quality map with green colouring representing a high quality elastogram. Corresponding longitudinal B mode image of the mid biceps brachii muscle (D), shear wave velocity image (E) and quality map (F). The velocity distribution is slightly different in the longitudinal plane compared with the transverse plane owing to the greater effect of anisotropy in the transverse plane compared with the longitudinal plane.
- Citation: Winn N, Lalam R, Cassar-Pullicino V. Sonoelastography in the musculoskeletal system: Current role and future directions. World J Radiol 2016; 8(11): 868-879
- URL: https://www.wjgnet.com/1949-8470/full/v8/i11/868.htm
- DOI: https://dx.doi.org/10.4329/wjr.v8.i11.868


