Copyright
©The Author(s) 2016.
World J Radiol. Oct 28, 2016; 8(10): 846-850
Published online Oct 28, 2016. doi: 10.4329/wjr.v8.i10.846
Published online Oct 28, 2016. doi: 10.4329/wjr.v8.i10.846
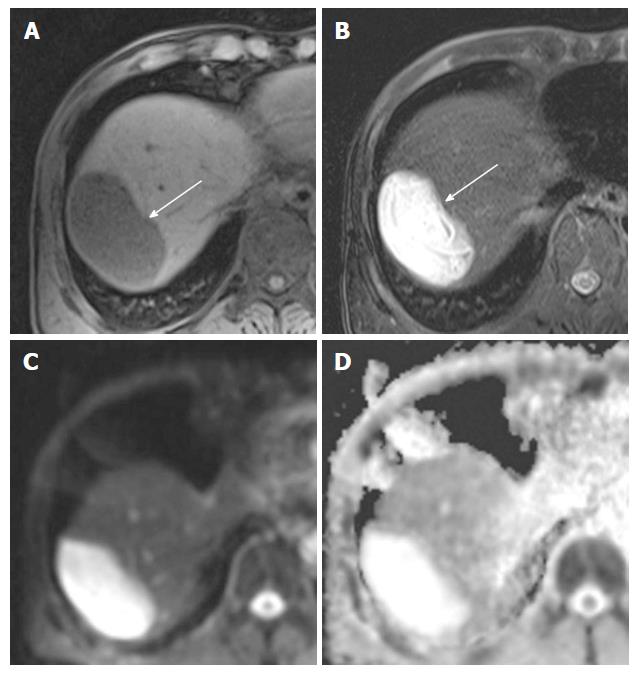
Figure 2 Liver magnetic resonance imaging.
A: Axial nonenhanced T1-weighted image showing that this hepatic mass (arrow) exhibits homogeneously low signal intensity; B: Fat-saturated axial T2-weighted image showing that the mass (arrow) exhibits very high signal intensity and internal serpiginous tubular structures; C and D: Axial diffusion-weighted image (C) and apparent diffusion coefficient map (D) showing that the diffusion in the mass is not restricted.
- Citation: Jo GD, Lee JY, Hong ST, Kim JH, Han JK. Presumptive case of sparganosis manifesting as a hepatic mass: A case report and literature review. World J Radiol 2016; 8(10): 846-850
- URL: https://www.wjgnet.com/1949-8470/full/v8/i10/846.htm
- DOI: https://dx.doi.org/10.4329/wjr.v8.i10.846


