Copyright
©The Author(s) 2016.
World J Radiol. Oct 28, 2016; 8(10): 819-828
Published online Oct 28, 2016. doi: 10.4329/wjr.v8.i10.819
Published online Oct 28, 2016. doi: 10.4329/wjr.v8.i10.819
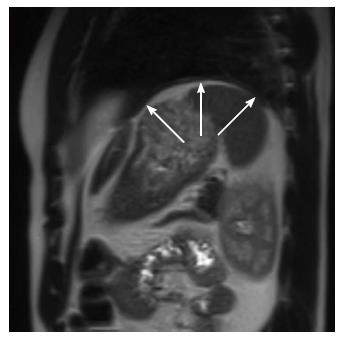
Figure 12 Magnetic resonance imaging apperarance of the diaphragm.
This TSE T2-weighted sagittal image shows the left hemidiaphragm as an uniformly thin intermediate signal intensity band (arrows) between lung parenchyma and intra-abdominal fat.
- Citation: Bonatti M, Lombardo F, Vezzali N, Zamboni GA, Bonatti G. Blunt diaphragmatic lesions: Imaging findings and pitfalls. World J Radiol 2016; 8(10): 819-828
- URL: https://www.wjgnet.com/1949-8470/full/v8/i10/819.htm
- DOI: https://dx.doi.org/10.4329/wjr.v8.i10.819


