Copyright
©The Author(s) 2016.
World J Radiol. Oct 28, 2016; 8(10): 819-828
Published online Oct 28, 2016. doi: 10.4329/wjr.v8.i10.819
Published online Oct 28, 2016. doi: 10.4329/wjr.v8.i10.819
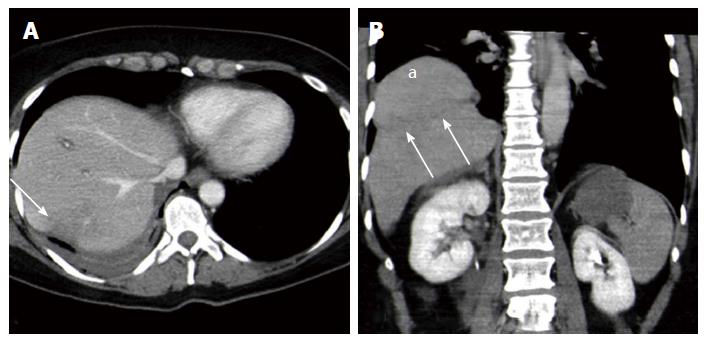
Figure 11 Computed tomography findings in blunt diaphragmatic lesions - hump and band sign.
These 3 mm thick multiplanar axial (A) and coronal (B) reconstructions show a hypodense band that crosses the liver parenchyma in the site where it crosses the ruptured diaphragm (arrows), whereas the liver dome expands above it. This alteration represents the so-called “hump and band sign” (a).
- Citation: Bonatti M, Lombardo F, Vezzali N, Zamboni GA, Bonatti G. Blunt diaphragmatic lesions: Imaging findings and pitfalls. World J Radiol 2016; 8(10): 819-828
- URL: https://www.wjgnet.com/1949-8470/full/v8/i10/819.htm
- DOI: https://dx.doi.org/10.4329/wjr.v8.i10.819


