Copyright
©The Author(s) 2016.
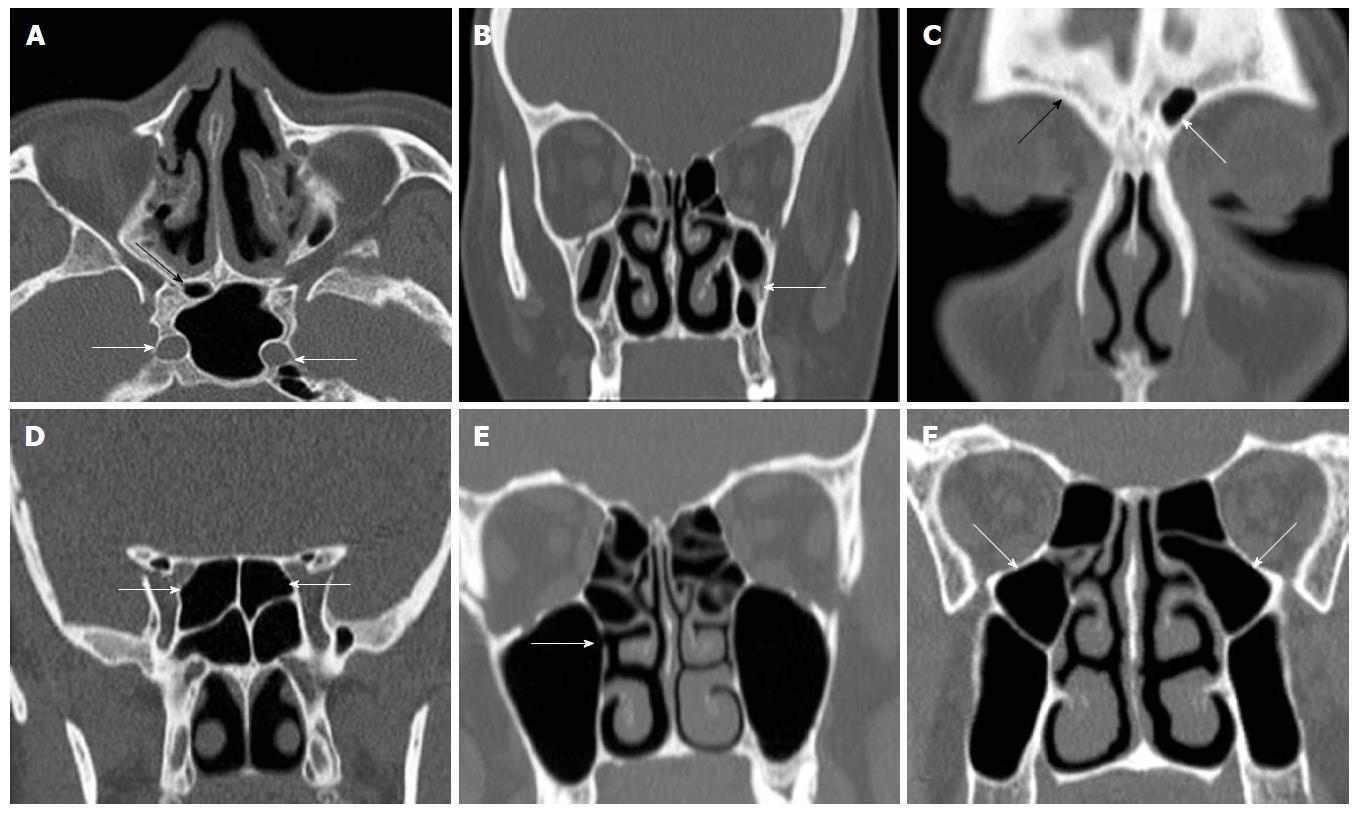
Figure 2 Axial plane (A), coronal reformatted (B-F) computerized tomography images shows different variations.
A: Right sphenoid sinus hypoplasia (black arrow) and bilaterally internal carotid artery protrusion into left sphenoid sinus; B: Bilaterally maxillary sinus hypoplasia and left intersinus septa (white arrow); C: Right frontal sinus aplasia (black arrow) and left frontal sinus hypoplasia (white arrow); D: Bilaterally Onodi cells (white arrows); E: Right maxillary sinus accessory ostium (white arrow); F: Bilaterally ethmomaxillary sinus.
- Citation: Dasar U, Gokce E. Evaluation of variations in sinonasal region with computed tomography. World J Radiol 2016; 8(1): 98-108
- URL: https://www.wjgnet.com/1949-8470/full/v8/i1/98.htm
- DOI: https://dx.doi.org/10.4329/wjr.v8.i1.98


