Copyright
©The Author(s) 2016.
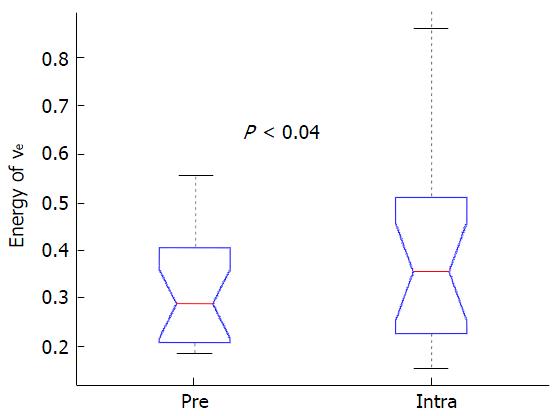
Figure 2 Box-and-whisker plot demonstrating the significant difference in the energy of ve between pretreatment and intra-treatmentscans (P < 0.
04). Pre: Pretreatment; Intra: Intra-treatment.
- Citation: Jansen JF, Lu Y, Gupta G, Lee NY, Stambuk HE, Mazaheri Y, Deasy JO, Shukla-Dave A. Texture analysis on parametric maps derived from dynamic contrast-enhanced magnetic resonance imaging in head and neck cancer. World J Radiol 2016; 8(1): 90-97
- URL: https://www.wjgnet.com/1949-8470/full/v8/i1/90.htm
- DOI: https://dx.doi.org/10.4329/wjr.v8.i1.90


