Copyright
©The Author(s) 2016.
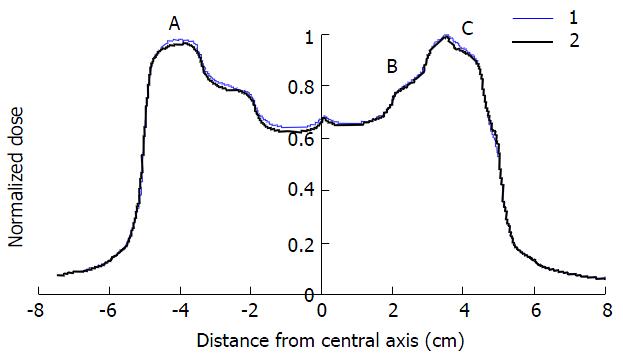
Figure 2 A comparison between beam profile for a beam affected by the overshoot effect of the biggest segment in the sequence (thin curve), and a beam with smaller segment (bold curve) on the first position in the segment sequence.
A, B and C are the dosimetric points of dose delivery.
- Citation: Grigorov GN, Chow JC. Leakage-Penumbra effect in intensity modulated radiation therapy step-and-shoot dose delivery. World J Radiol 2016; 8(1): 73-81
- URL: https://www.wjgnet.com/1949-8470/full/v8/i1/73.htm
- DOI: https://dx.doi.org/10.4329/wjr.v8.i1.73


