Copyright
©The Author(s) 2016.
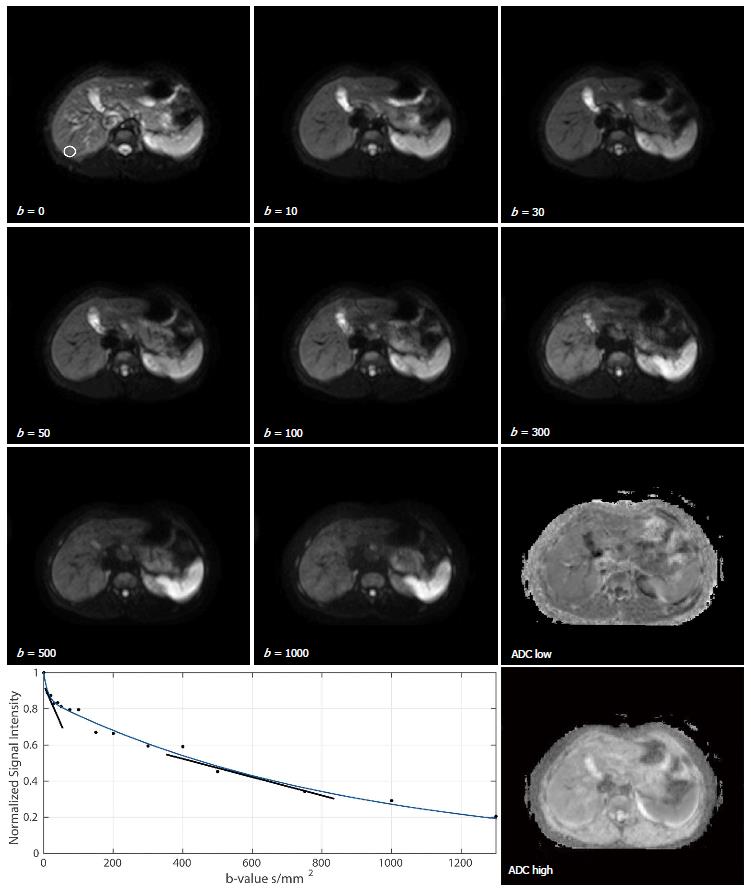
Figure 2 Diffusion-weighted magnetic resonance images of the abdomen of a healthy 25-year-old male volunteer at different b-values of 0, 10, 30, 50, 100, 300, 500, 1000 s/mm2.
An ROI placed over a non-heterogeneous region in the liver is shown on the b = 0 s/mm2 image. A bi-exponential fit to the ROI drawn on the diffusion-weighted-magnetic resonance data acquired with b-values of 0, 10, 20, 30, 40, 50, 75, 100, 150, 200, 300, 400, 500, 750, 1000 and 1300 s/mm2 is also shown where the slopes of the exponents represent the fast diffusion component (which includes perfusion) and the slower diffusion component. Quantitative apparent diffusion coefficients maps are also shown where ADC low was computed with b-values ≤ 100 s/mm2 and ADC high was computed with b-values ≥ 150 s/mm2. ROI: Region-of-interest; ADC: Apparent diffusion coefficient.
- Citation: Jafar MM, Parsai A, Miquel ME. Diffusion-weighted magnetic resonance imaging in cancer: Reported apparent diffusion coefficients, in-vitro and in-vivo reproducibility. World J Radiol 2016; 8(1): 21-49
- URL: https://www.wjgnet.com/1949-8470/full/v8/i1/21.htm
- DOI: https://dx.doi.org/10.4329/wjr.v8.i1.21


