Copyright
©The Author(s) 2015.
World J Radiol. Sep 28, 2015; 7(9): 220-235
Published online Sep 28, 2015. doi: 10.4329/wjr.v7.i9.220
Published online Sep 28, 2015. doi: 10.4329/wjr.v7.i9.220
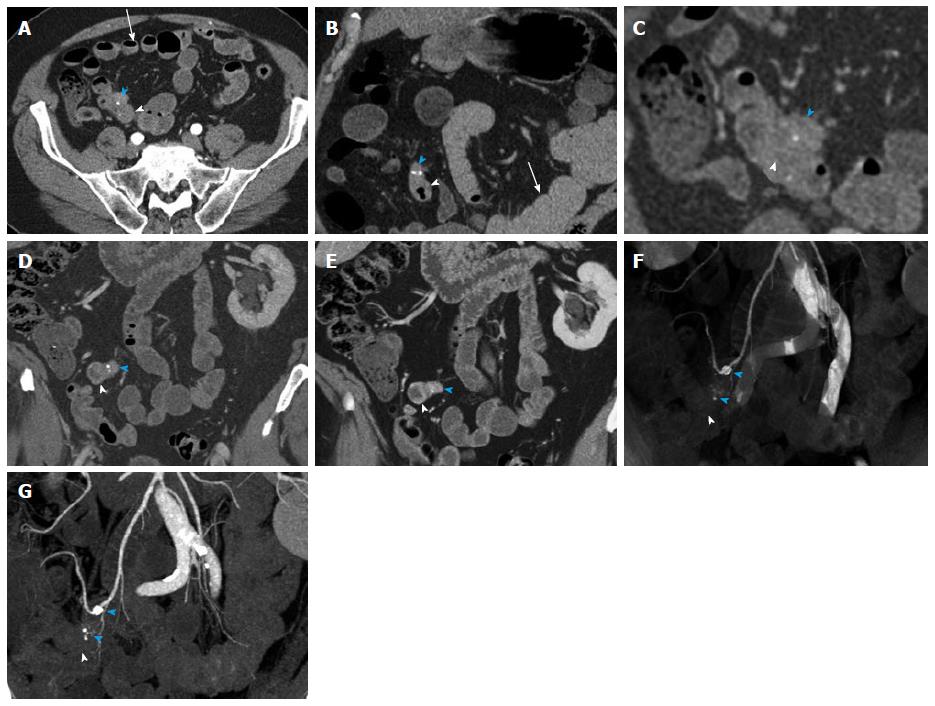
Figure 8 Small bowel carcinoid.
A 71-year-old male with small bowel carcinoid, who presented with intermittent abdominal pain and small bowel obstruction. He underwent a 40 cm distal ileal resection, demonstrating a 1.5 cm carcinoid tumor (pT3, invading into subserosal tissue), with regional nodal metastases (2 of 21). After 6 mo of available follow up, there is currently no evidence of metastatic or residual disease. This case illustrates the evaluation of a primary tumor in an underdistended small bowel segment in the setting of small bowel obstruction caused by the mass. Depiction of locoregional metastatic disease. A: Axial arterial phase CTA image shows a small focal area of asymmetric wall thickening in an underdistended small bowel loop (arrowhead), representative of the primary tumor. There is directly adjacent metastatic adenopathy with small calcifications (blue arrowhead). Note that these findings are rather subtle on the axial images. Multiple proximal small bowel loops with fluid levels are compatible with partial small bowel obstruction (arrow). The presence of SBO limits the ability of oral contrast to aid in adequate distention of the pathological small bowel segment; B: Coronal arterial phase image better demonstrates asymmetric wall thickening (arrowhead) and extramural mesenteric extension of tumor with calcifications (blue arrowhead). Multiple dilated proximal small bowel loops are compatible with partial small bowel obstruction (arrow); C: Thin slice reconstructions (0.75 mm) of the venous phase data allow better evaluation of the small bowel mass (arrowhead) and the adjacent calcified mesenteric mass (blue arrowhead); D, E: Coronal thin (D) and thick (E) slab MIP images of the venous phase data demonstrate the small bowel mass (arrowheads) and the adjacent metastatic calcified adenopathy (blue arrowheads) to better advantage; F, G: Coronal VRT (F) and MIP (G) of the CTA data demonstrate the mass (arrowheads) and associated calcified nodal masses (blue arrowheads) in relation to the mesenteric vessels. VRT: Volume rendered technique; MIP: Maximum intensity projections; CTA: Computed tomography angiography. SBO: Small bowel obstruction.
- Citation: Bonekamp D, Raman SP, Horton KM, Fishman EK. Role of computed tomography angiography in detection and staging of small bowel carcinoid tumors. World J Radiol 2015; 7(9): 220-235
- URL: https://www.wjgnet.com/1949-8470/full/v7/i9/220.htm
- DOI: https://dx.doi.org/10.4329/wjr.v7.i9.220


