Copyright
©The Author(s) 2015.
World J Radiol. Jul 28, 2015; 7(7): 170-179
Published online Jul 28, 2015. doi: 10.4329/wjr.v7.i7.170
Published online Jul 28, 2015. doi: 10.4329/wjr.v7.i7.170
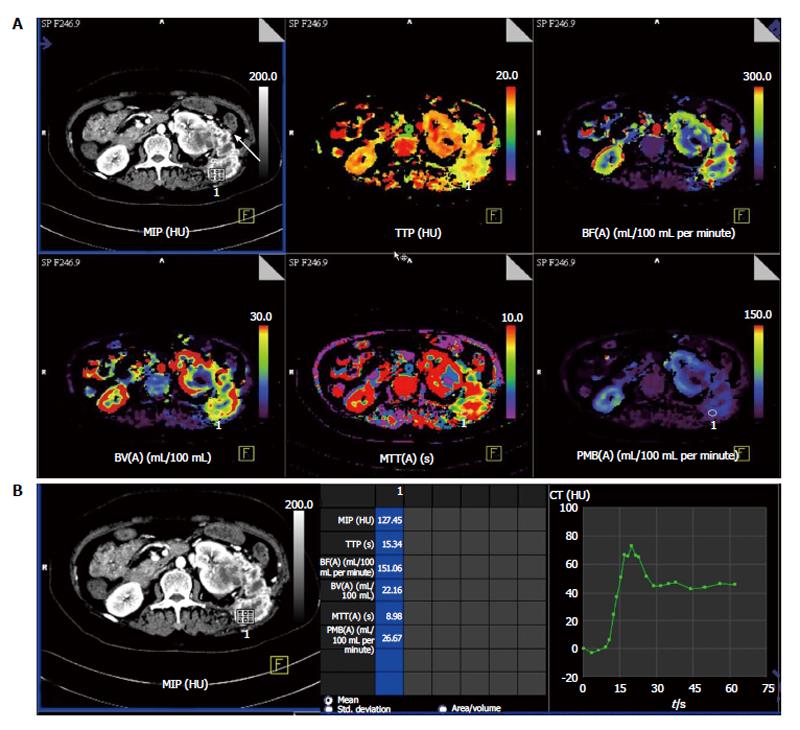
Figure 3 Perfusion computed tomography in a 55-year-old lady with metastatic left renal cell carcinoma.
A: Contrast computed tomography (CT) images show heterogeneous necrotic mass in left kidney with abdominal wall metastatic deposit in left lumbar region (arrow) and colour-coded perfusion maps show the perfusion parameters; B: Time attenuation curve and perfusion parameters with region-of-interest placed in the metastatic left lumbar lesion depict delayed wash-out of contrast from the tumour deposit. MIP: Maximum peak intensity; TTP: Time to peak; BF: Blood flow; BV: Blood volume; MTT: Mean transit time; PMB: Permeanbility.
- Citation: Das CJ, Thingujam U, Panda A, Sharma S, Gupta AK. Perfusion computed tomography in renal cell carcinoma. World J Radiol 2015; 7(7): 170-179
- URL: https://www.wjgnet.com/1949-8470/full/v7/i7/170.htm
- DOI: https://dx.doi.org/10.4329/wjr.v7.i7.170


