Copyright
©The Author(s) 2015.
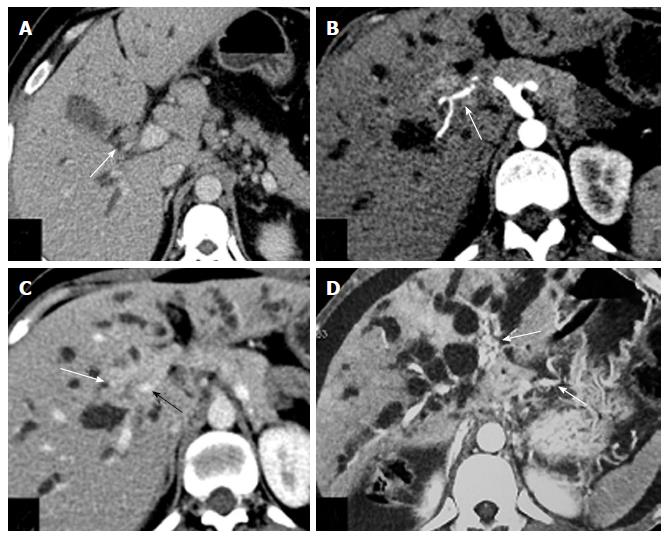
Figure 12 Axial computed tomography scan images showing vascular invasion.
A: Small hilar mass (white arrow) abutting right hepatic artery posteriorly; B: Hilar mass (white arrow) encasing right hepatic artery causing irregularity in outline; C: Ill-defined hilar mass (white arrow) encasing portal vein and causing its narrowing (black arrow); D: Multiple collaterals (white arrows) seen in periportal and perigastric location due to portal vein obstruction.
- Citation: Madhusudhan KS, Gamanagatti S, Gupta AK. Imaging and interventions in hilar cholangiocarcinoma: A review. World J Radiol 2015; 7(2): 28-44
- URL: https://www.wjgnet.com/1949-8470/full/v7/i2/28.htm
- DOI: https://dx.doi.org/10.4329/wjr.v7.i2.28


