Copyright
©The Author(s) 2015.
World J Radiol. Dec 28, 2015; 7(12): 521-530
Published online Dec 28, 2015. doi: 10.4329/wjr.v7.i12.521
Published online Dec 28, 2015. doi: 10.4329/wjr.v7.i12.521
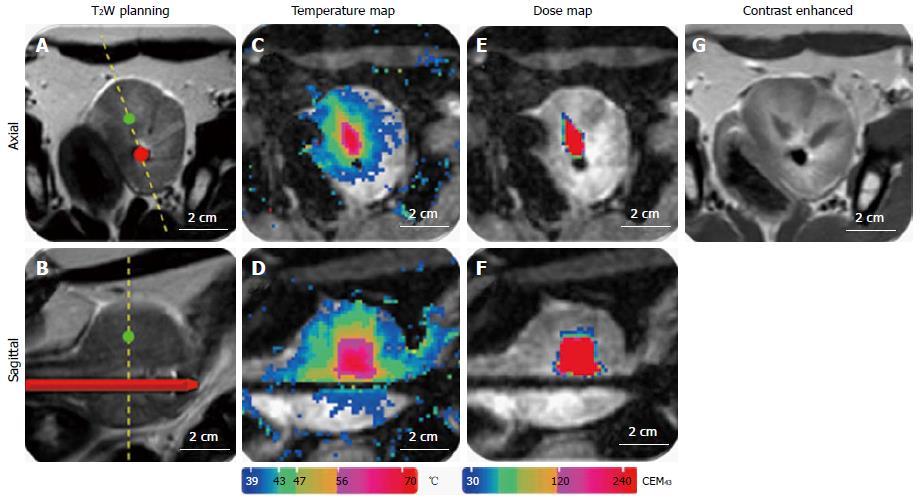
Figure 12 Representative images of magnetic resonance imaging-guidance.
A: T2-weighted image for positioning and treatment planning in axial and sagittal orientation (B); C: MR temperature map during ultrasound treatment in axial and sagittal orientation (D); E: MR dose map during ultrasound treatment in axial and sagittal orientation (F); G: Contrast enhanced T1-weighted image after ultrasound treatment. MR: Magnetic resonance.
- Citation: Sammet S, Partanen A, Yousuf A, Sammet CL, Ward EV, Wardrip C, Niekrasz M, Antic T, Razmaria A, Farahani K, Sokka S, Karczmar G, Oto A. Cavernosal nerve functionality evaluation after magnetic resonance imaging-guided transurethral ultrasound treatment of the prostate. World J Radiol 2015; 7(12): 521-530
- URL: https://www.wjgnet.com/1949-8470/full/v7/i12/521.htm
- DOI: https://dx.doi.org/10.4329/wjr.v7.i12.521


