Copyright
©The Author(s) 2015.
World J Radiol. Dec 28, 2015; 7(12): 448-458
Published online Dec 28, 2015. doi: 10.4329/wjr.v7.i12.448
Published online Dec 28, 2015. doi: 10.4329/wjr.v7.i12.448
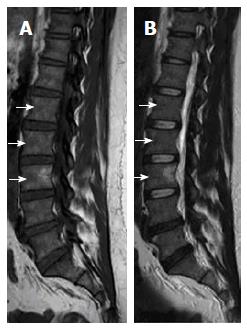
Figure 6 Sagittal T1W (A) and T2W (B) images of 41-year-old female showing LV3 patch of high-signal intensity (unchanged on serial magnetic resonance follow-up; not shown) on both T1W and T2W with fuzzy margins, proved to focal fatty metaplasia.
Note areas of low signal intensity under the anterior cortex of multiple adjacent vertebral bodies (short white arrows) corresponding to focal nodules of red marrow.
- Citation: Nouh MR, Eid AF. Magnetic resonance imaging of the spinal marrow: Basic understanding of the normal marrow pattern and its variant. World J Radiol 2015; 7(12): 448-458
- URL: https://www.wjgnet.com/1949-8470/full/v7/i12/448.htm
- DOI: https://dx.doi.org/10.4329/wjr.v7.i12.448


