Copyright
©The Author(s) 2015.
World J Radiol. Nov 28, 2015; 7(11): 394-404
Published online Nov 28, 2015. doi: 10.4329/wjr.v7.i11.394
Published online Nov 28, 2015. doi: 10.4329/wjr.v7.i11.394
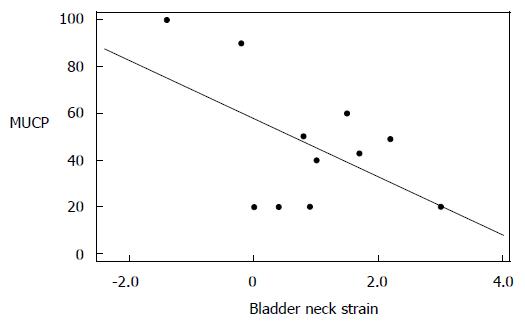
Figure 3 Scatter plot of maximum urethral closure pressure (cm H20) and bladder neck strain (distance in cm, traveled between position at rest and maximal strain) with fitted regression line (Pearson’s correlation coefficient -0.
537, P = 0.089). MUCP: Maximum urethral closure pressure.
- Citation: Macura KJ, Thompson RE, Bluemke DA, Genadry R. Magnetic resonance imaging in assessment of stress urinary incontinence in women: Parameters differentiating urethral hypermobility and intrinsic sphincter deficiency. World J Radiol 2015; 7(11): 394-404
- URL: https://www.wjgnet.com/1949-8470/full/v7/i11/394.htm
- DOI: https://dx.doi.org/10.4329/wjr.v7.i11.394


