Copyright
©The Author(s) 2015.
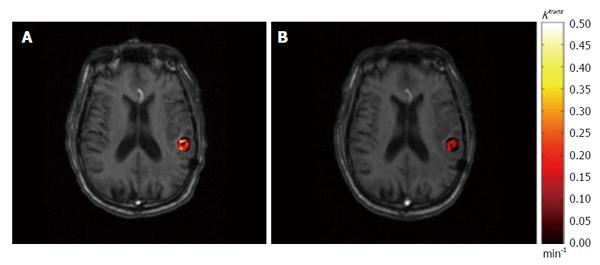
Figure 3 An example of permeability rate constant Ktrans map derived from dynamic contrast-enhanced imaging.
The pre-treatment (A) and post-treatment (B) Ktrans results within gross tumor volume are superimposed on axial T1-weighted magnetic resonance images.
- Citation: Chang Z, Wang C. Treatment assessment of radiotherapy using MR functional quantitative imaging. World J Radiol 2015; 7(1): 1-6
- URL: https://www.wjgnet.com/1949-8470/full/v7/i1/1.htm
- DOI: https://dx.doi.org/10.4329/wjr.v7.i1.1


