Copyright
©2014 Baishideng Publishing Group Inc.
World J Radiol. Sep 28, 2014; 6(9): 737-740
Published online Sep 28, 2014. doi: 10.4329/wjr.v6.i9.737
Published online Sep 28, 2014. doi: 10.4329/wjr.v6.i9.737
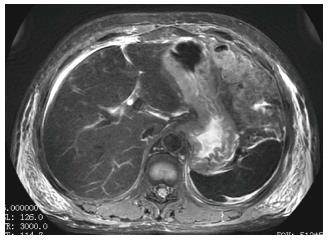
Figure 4 Axial Fat Suppressed T2 Weighted Periodically Rotated Overlapping Parallel Lines with Enhanced Reconstruction FSE image of the abdomen shows decreased signal intensity of the spleen as well as the liver as compared to that of paraspinal muscle.
- Citation: Das SK, Zeng LC, Li B, Niu XK, Wang JL, Bhetuwal A, Yang HF. Magnetic resonance imaging correlates of bee sting induced multiple organ dysfunction syndrome: A case report. World J Radiol 2014; 6(9): 737-740
- URL: https://www.wjgnet.com/1949-8470/full/v6/i9/737.htm
- DOI: https://dx.doi.org/10.4329/wjr.v6.i9.737


