Copyright
©2014 Baishideng Publishing Group Inc.
World J Radiol. Sep 28, 2014; 6(9): 693-707
Published online Sep 28, 2014. doi: 10.4329/wjr.v6.i9.693
Published online Sep 28, 2014. doi: 10.4329/wjr.v6.i9.693
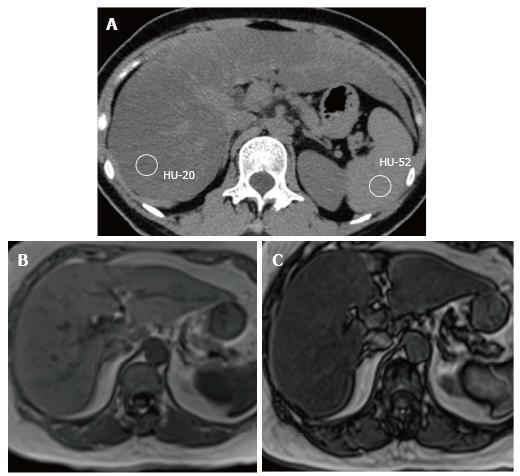
Figure 17 Diffuse hepatic steatosis is demonstrated here.
In the non-enhanced computed tomography scan (A) the hepatic parenchyma has significantly lower attenuation than spleen. The out phase magnetic resonance imaging image (C) shows a drop in the hepatic signal intensity compared to that in the in-phase image (B).
- Citation: Hennedige T, Anil G, Madhavan K. Expectations from imaging for pre-transplant evaluation of living donor liver transplantation. World J Radiol 2014; 6(9): 693-707
- URL: https://www.wjgnet.com/1949-8470/full/v6/i9/693.htm
- DOI: https://dx.doi.org/10.4329/wjr.v6.i9.693


