Copyright
©2014 Baishideng Publishing Group Inc.
World J Radiol. Sep 28, 2014; 6(9): 693-707
Published online Sep 28, 2014. doi: 10.4329/wjr.v6.i9.693
Published online Sep 28, 2014. doi: 10.4329/wjr.v6.i9.693
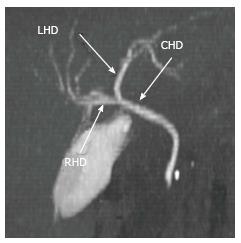
Figure 16 Maximum intensity projection image generated from a computed tomography cholangiogram.
Normal biliary anatomy is demonstrated here. LHD: Left hepatic duct; RHD: Right hepatic duct; CHD: Common hepatic duct.
- Citation: Hennedige T, Anil G, Madhavan K. Expectations from imaging for pre-transplant evaluation of living donor liver transplantation. World J Radiol 2014; 6(9): 693-707
- URL: https://www.wjgnet.com/1949-8470/full/v6/i9/693.htm
- DOI: https://dx.doi.org/10.4329/wjr.v6.i9.693


