Copyright
©2014 Baishideng Publishing Group Inc.
World J Radiol. Sep 28, 2014; 6(9): 669-676
Published online Sep 28, 2014. doi: 10.4329/wjr.v6.i9.669
Published online Sep 28, 2014. doi: 10.4329/wjr.v6.i9.669
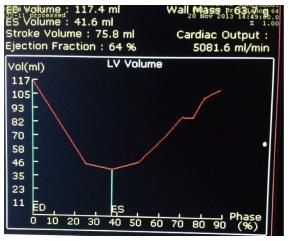
Figure 3 Time-volume curve display of left ventricular volume over different phases of the cardiac cycle (R-R interval) and calculation of left ventricular ejection fraction is displayed automatically.
Please note the smooth normal curve without registration artifact.
- Citation: Singh RM, Singh BM, Mehta JL. Role of cardiac CTA in estimating left ventricular volumes and ejection fraction. World J Radiol 2014; 6(9): 669-676
- URL: https://www.wjgnet.com/1949-8470/full/v6/i9/669.htm
- DOI: https://dx.doi.org/10.4329/wjr.v6.i9.669


