Copyright
©2014 Baishideng Publishing Group Inc.
World J Radiol. Aug 28, 2014; 6(8): 598-606
Published online Aug 28, 2014. doi: 10.4329/wjr.v6.i8.598
Published online Aug 28, 2014. doi: 10.4329/wjr.v6.i8.598
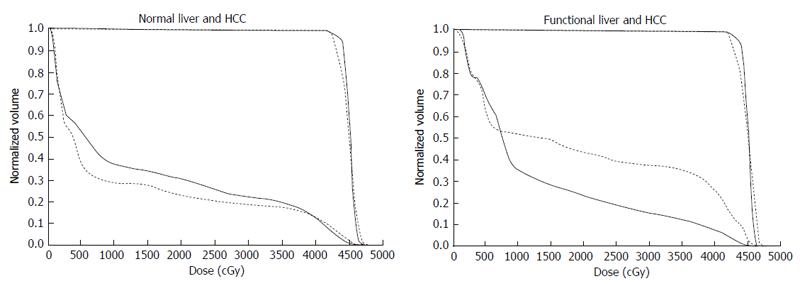
Figure 7 Comparison of dose-volume histograms between actual treatment plans (solid lines) and hypothetical treatment plans (dotted lines).
A: Comparison of the DVH for normal liver. In this case, the percentage of the normal liver irradiated with ≥ 20 Gy (NLV20Gy) was 23.1% for the hypothetical treatment plan vs 30.8% for the actual treatment plan. Therefore, irradiation of normal liver is lower for the hypothetical treatment plan than for the actual treatment plan; B: Comparison of the DVH for functional liver. In this case, the percentage of functional liver irradiated with ≥ 20 Gy (FLV20Gy) was 43.7% for the hypothetical treatment plan vs 23.8% for the actual treatment plan. Therefore, irradiation of functional liver is lower for the actual treatment plan than for the hypothetical treatment plan. The difference between NLV20Gy and FLV20Gy in these two settings is due to the uneven distribution of functional liver. DVH: Dose-volume histograms; HCC: Hepatocellular carcinoma.
- Citation: Shirai S, Sato M, Noda Y, Kumayama Y, Shimizu N. Incorporating GSA-SPECT into CT-based dose-volume histograms for advanced hepatocellular carcinoma radiotherapy. World J Radiol 2014; 6(8): 598-606
- URL: https://www.wjgnet.com/1949-8470/full/v6/i8/598.htm
- DOI: https://dx.doi.org/10.4329/wjr.v6.i8.598


