Copyright
©2014 Baishideng Publishing Group Inc.
World J Radiol. Aug 28, 2014; 6(8): 598-606
Published online Aug 28, 2014. doi: 10.4329/wjr.v6.i8.598
Published online Aug 28, 2014. doi: 10.4329/wjr.v6.i8.598
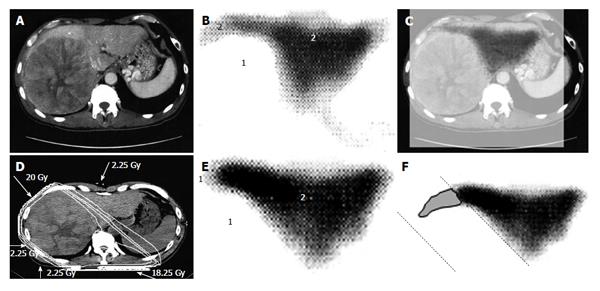
Figure 2 A 53-year-old man with hepatocellular carcinoma with a maximum diameter of 16.
5 cm. A: Contrast-enhanced computed tomography; B: Single photon emission computed tomography with Tc-99m-galactosyl human serum albumin before radiotherapy; C: The merged image of A and B; The regions (1) without GSA accumulation in B correspond to main tumor located in the right lobe. The regions (2) of high accumulation in B correspond to functional liver. These regions were identified using the merged image (C); D: Dose distribution based on the CT simulation; E: GSA-SPECT image obtained 2 mo after RT shows regions without GSA accumulation (1) along the two high-dose beams, with preservation of functional liver (2); F: The extent of radiation-induced dysfunctional liver is shown as the gray area with a black border and was determined by comparing B and E. GSA: Galactosyl human serum albumin; SPECT: Single photon emission computed tomography; CT: Computed tomography; RT: Radiotherapy.
- Citation: Shirai S, Sato M, Noda Y, Kumayama Y, Shimizu N. Incorporating GSA-SPECT into CT-based dose-volume histograms for advanced hepatocellular carcinoma radiotherapy. World J Radiol 2014; 6(8): 598-606
- URL: https://www.wjgnet.com/1949-8470/full/v6/i8/598.htm
- DOI: https://dx.doi.org/10.4329/wjr.v6.i8.598


