Copyright
©2014 Baishideng Publishing Group Inc.
World J Radiol. Aug 28, 2014; 6(8): 544-566
Published online Aug 28, 2014. doi: 10.4329/wjr.v6.i8.544
Published online Aug 28, 2014. doi: 10.4329/wjr.v6.i8.544
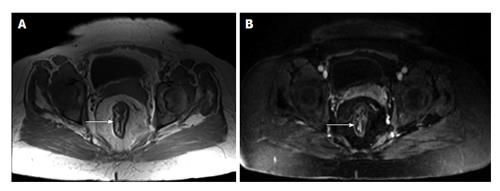
Figure 18 Chronic ulcerative colitis.
A: Axial in-phase T1-weighted; B: Axial fat-suppressed post-gadolinium 3D-GRE T1-weighted images. There is diffuse rectal submucosal increased T1 signal (arrow, A), which demonstrates low signal on fat-suppression (arrow, B), but no significant arterial enhancement (B), in keeping with chronic ulcerative colitis. GRE: Gradient recalled echo.
- Citation: Liu B, Ramalho M, AlObaidy M, Busireddy KK, Altun E, Kalubowila J, Semelka RC. Gastrointestinal imaging-practical magnetic resonance imaging approach. World J Radiol 2014; 6(8): 544-566
- URL: https://www.wjgnet.com/1949-8470/full/v6/i8/544.htm
- DOI: https://dx.doi.org/10.4329/wjr.v6.i8.544


