Copyright
©2014 Baishideng Publishing Group Inc.
World J Radiol. Aug 28, 2014; 6(8): 530-537
Published online Aug 28, 2014. doi: 10.4329/wjr.v6.i8.530
Published online Aug 28, 2014. doi: 10.4329/wjr.v6.i8.530
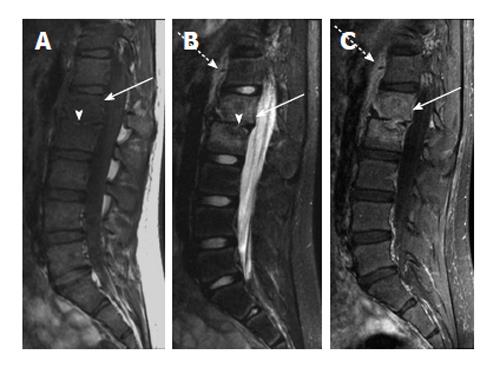
Figure 3 Chronic vertebral diskitis-osteomyelitis secondary to S.
typhi. A: Sagittal T1-weighted image shows abnormally decreased T1 marrow signal in the L1 and L2 vertebral bodies (arrow) and loss of the L1-2 disk space (arrowhead); B: Sagittal T2-weighted image with fat suppression shows abnormally increased T2 signal in the L1 and L2 vertebral bodies (solid arrow) with loss of normal T2 intervertebral disk signal (arrowhead). T2 hyperintensity anterior to the spine (dashed arrow) likely represents adjacent soft tissue edema; C: Sagittal T1-weighted image after intravenous contrast shows intramedullary enhancement in the L1 and L2 vertebral bodies (solid arrow) with soft tissue enhancement anterior to the spine (dashed arrow).
- Citation: Pugmire BS, Shailam R, Gee MS. Role of MRI in the diagnosis and treatment of osteomyelitis in pediatric patients. World J Radiol 2014; 6(8): 530-537
- URL: https://www.wjgnet.com/1949-8470/full/v6/i8/530.htm
- DOI: https://dx.doi.org/10.4329/wjr.v6.i8.530


