Copyright
©2014 Baishideng Publishing Group Inc.
World J Radiol. Jul 28, 2014; 6(7): 459-470
Published online Jul 28, 2014. doi: 10.4329/wjr.v6.i7.459
Published online Jul 28, 2014. doi: 10.4329/wjr.v6.i7.459
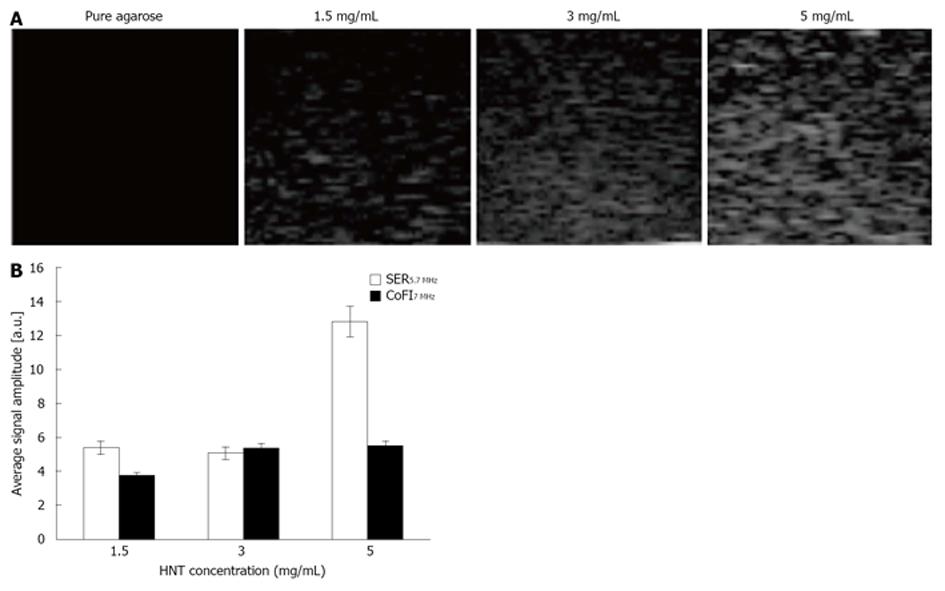
Figure 4 Ultrasound detection of halloysite clay nanotube.
A: Gel sample echographic images of pure and agarose containing halloysite clay nanotube (HNT) at the indicated concentrations; B: Quantitative analysis of backscattered signal as a function of ultrasonic frequency and HNT concentration. SER: Signal enhancement ratio; CoFI: Contribution of frequency increment.
- Citation: Di Paola M, Chiriacò F, Soloperto G, Conversano F, Casciaro S. Echographic imaging of tumoral cells through novel nanosystems for image diagnosis. World J Radiol 2014; 6(7): 459-470
- URL: https://www.wjgnet.com/1949-8470/full/v6/i7/459.htm
- DOI: https://dx.doi.org/10.4329/wjr.v6.i7.459


