Copyright
©2014 Baishideng Publishing Group Inc.
World J Radiol. Jun 28, 2014; 6(6): 381-387
Published online Jun 28, 2014. doi: 10.4329/wjr.v6.i6.381
Published online Jun 28, 2014. doi: 10.4329/wjr.v6.i6.381
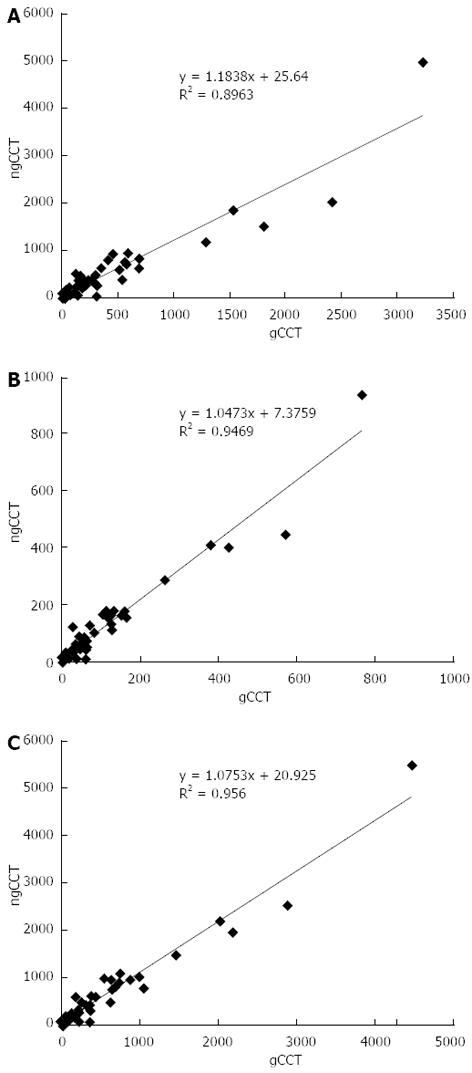
Figure 2 Scatter plots coronary artery calcium score values.
The scatter plots show the high correlation of Volume (A), Mass (B), and Agatston (C) scores obtained with gCCT and ngCCT. gCCT: ECG gated cardiac computed tomography; ngCCT: Non-gated chest computed tomography.
- Citation: Arcadi T, Maffei E, Sverzellati N, Mantini C, Guaricci AI, Tedeschi C, Martini C, Grutta LL, Cademartiri F. Coronary artery calcium score on low-dose computed tomography for lung cancer screening. World J Radiol 2014; 6(6): 381-387
- URL: https://www.wjgnet.com/1949-8470/full/v6/i6/381.htm
- DOI: https://dx.doi.org/10.4329/wjr.v6.i6.381


