Copyright
©2014 Baishideng Publishing Group Inc.
World J Radiol. Jun 28, 2014; 6(6): 329-343
Published online Jun 28, 2014. doi: 10.4329/wjr.v6.i6.329
Published online Jun 28, 2014. doi: 10.4329/wjr.v6.i6.329
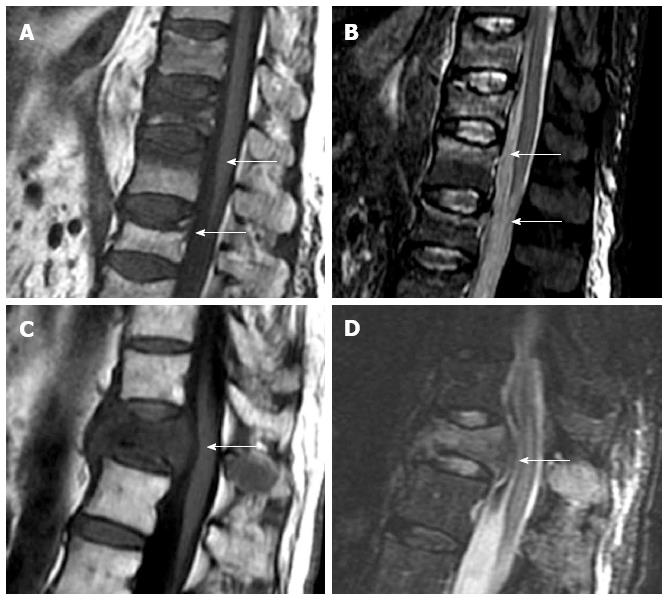
Figure 2 Sagittal T1 weighted (A) and STIR (B) images of osteoporotic fractures with typical band-like subchondral edema (arrows), sagittal T1 weighted (C) and STIR images (D) of a pathologic fracture, due to vertebral metastases, with typical convex border (arrows).
- Citation: Santiago FR, Chinchilla AS, Álvarez LG, Abela ALP, García MDMC, López MP. Comparative review of vertebroplasty and kyphoplasty. World J Radiol 2014; 6(6): 329-343
- URL: https://www.wjgnet.com/1949-8470/full/v6/i6/329.htm
- DOI: https://dx.doi.org/10.4329/wjr.v6.i6.329


