Copyright
©2014 Baishideng Publishing Group Inc.
World J Radiol. May 28, 2014; 6(5): 192-202
Published online May 28, 2014. doi: 10.4329/wjr.v6.i5.192
Published online May 28, 2014. doi: 10.4329/wjr.v6.i5.192
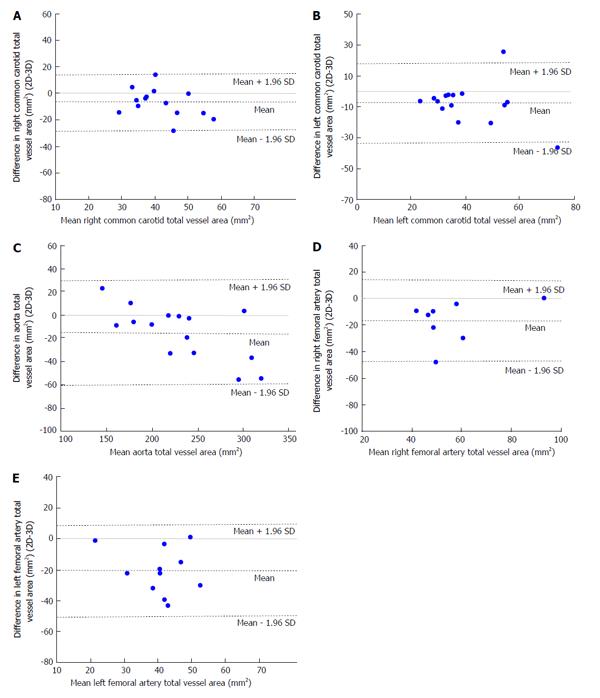
Figure 5 Bland-Altman plot of differences in total vessel area (two-dimensional-three-dimensional) vs means of total vessel area.
A: Bland-Altman plot of difference in right common carotid (RCC) total vessel area [two-dimensional (2D)-3D] vs mean RCC total vessel area. Bland-Altman plot showing that the mean of the difference in RCC total vessel area between 2D and 3D techniques falls below the zero line indicating that there is a bias and that the two methods are not producing the same results; B: Bland-Altman plot of difference in left common carotid (LCC) total vessel area (2D-3D) versus mean LCC total vessel area. Bland-Altman plot showing that the mean of the difference in LCC total vessel area between 2D and 3D techniques falls below the zero line indicating that there is a bias and that the two methods are not producing the same results; C: Bland-Altman plot of difference in aorta total vessel area (2D-3D) vs mean aorta total vessel area. Bland-Altman plot showing that the mean of the difference in aorta total vessel area between 2D and 3D techniques falls below the zero line indicating that there is a bias and that the two methods are not producing the same results; D: Bland-Altman plot of difference in right femoral (RF) total vessel area (2D-3D) vs mean RF total vessel area. Bland-Altman plot showing that the mean of the difference in RF total vessel area between 2D and 3D techniques falls below the zero line indicating that there is a bias and that the two methods are not producing the same results; E: Bland-Altman plot of difference in left femoral (LF) total vessel area (2D-3D) vs mean LF total vessel area. Bland-Altman plot showing that the mean of the difference in LF total vessel area between 2D and 3D techniques falls below the zero line indicating that there is a bias and that the two methods are not producing the same results.
-
Citation: Wong SK, Mobolaji-Iawal M, Arama L, Cambe J, Biso S, Alie N, Fayad ZA, Mani V. Atherosclerosis imaging using 3D black blood TSE SPACE
vs 2D TSE. World J Radiol 2014; 6(5): 192-202 - URL: https://www.wjgnet.com/1949-8470/full/v6/i5/192.htm
- DOI: https://dx.doi.org/10.4329/wjr.v6.i5.192


