Copyright
©2014 Baishideng Publishing Group Inc.
World J Radiol. May 28, 2014; 6(5): 192-202
Published online May 28, 2014. doi: 10.4329/wjr.v6.i5.192
Published online May 28, 2014. doi: 10.4329/wjr.v6.i5.192
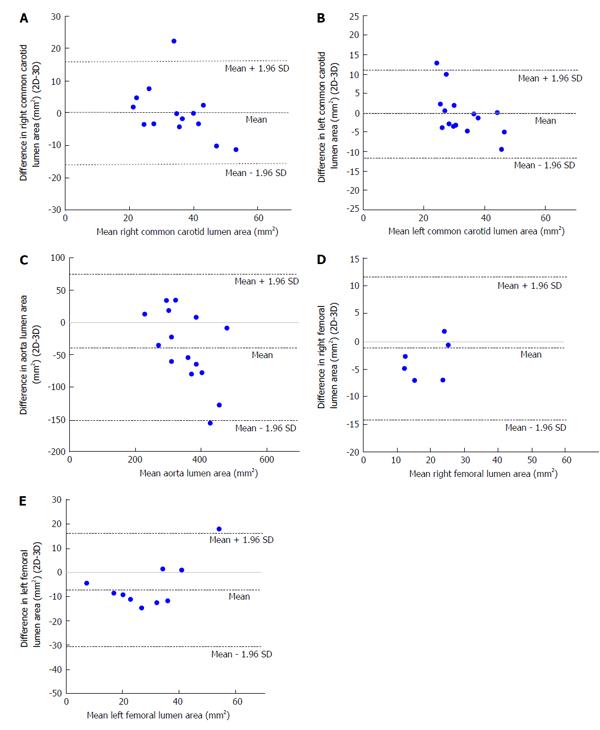
Figure 4 Bland-Altman plot of differences in lumen area (two-dimensional-three-dimensional) vs means of lumen area.
A: Bland-Altman plot of difference in right common carotid (RCC) lumen area [two-dimensional (2D)-3D] vs mean RCC lumen area. Bland-Altman plot showing that the mean of the difference in RCC lumen area between 2D and 3D techniques falls on the zero line indicating that there is no bias and that the two methods are producing the same results; B: Bland–Altman plot of difference in left common carotid (LCC) lumen area (2D-3D) vs mean LCC lumen area. Bland-Altman plot showing that the mean of the difference in LCC lumen area between 2D and 3D techniques falls close to the zero line indicating that there is no bias and that in general the two methods are producing the same results; C: Bland-Altman plot of difference in aorta lumen area (2D-3D) vs mean aorta lumen area. Bland-Altman plot showing that the mean of the difference in aorta lumen area between 2D and 3D techniques falls below the zero line indicating that there is a bias and that the two methods are not producing the same results; D: Bland-Altman plot of difference in right femoral (RF) lumen area (2D-3D) vs mean RF lumen area. Bland-Altman plot showing that the mean of the difference in RF lumen area between 2D and 3D techniques falls below the zero line indicating that there is a bias and that the two methods are not producing the same results; E: Bland-Altman plot of difference in left femoral (LF) lumen area (2D-3D) vs mean LF lumen area. Bland-Altman plot showing that the mean of the difference in LF lumen area between 2D and 3D techniques falls below the zero line indicating that there is a bias and that the two methods are not producing the same results.
-
Citation: Wong SK, Mobolaji-Iawal M, Arama L, Cambe J, Biso S, Alie N, Fayad ZA, Mani V. Atherosclerosis imaging using 3D black blood TSE SPACE
vs 2D TSE. World J Radiol 2014; 6(5): 192-202 - URL: https://www.wjgnet.com/1949-8470/full/v6/i5/192.htm
- DOI: https://dx.doi.org/10.4329/wjr.v6.i5.192


