Copyright
©2014 Baishideng Publishing Group Inc.
World J Radiol. May 28, 2014; 6(5): 148-159
Published online May 28, 2014. doi: 10.4329/wjr.v6.i5.148
Published online May 28, 2014. doi: 10.4329/wjr.v6.i5.148
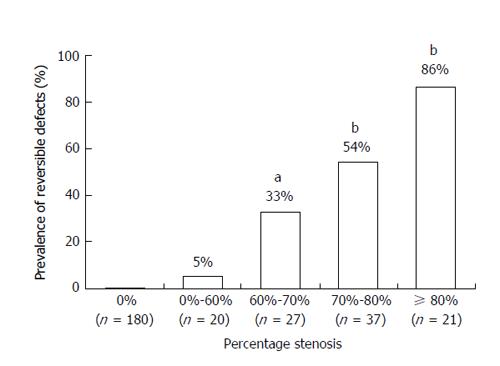
Figure 4 Prevalence of reversible defects evaluated by single-photon emission tomography in the study groups defined according to the percentage stenosis obtained by computed tomography angiography[15].
Numbers under the bars represent the number of vessels. aP = 0.018, bP < 0.0001 vs percentage stenosis of 0%-60%.
- Citation: Sato A. Coronary plaque imaging by coronary computed tomography angiography. World J Radiol 2014; 6(5): 148-159
- URL: https://www.wjgnet.com/1949-8470/full/v6/i5/148.htm
- DOI: https://dx.doi.org/10.4329/wjr.v6.i5.148


