Copyright
©2014 Baishideng Publishing Group Inc.
World J Radiol. May 28, 2014; 6(5): 148-159
Published online May 28, 2014. doi: 10.4329/wjr.v6.i5.148
Published online May 28, 2014. doi: 10.4329/wjr.v6.i5.148
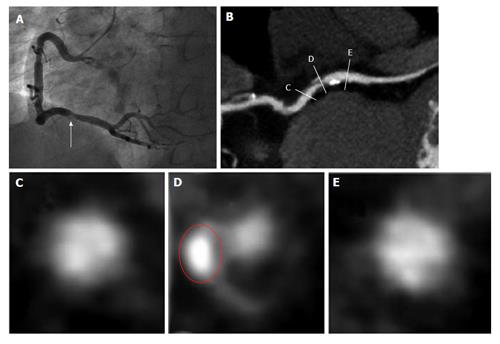
Figure 3 The computed tomography characteristics of a culprit lesion in the 52-year-old male patient with post-percutaneous coronary intervention troponin T elevation ≥ 3 × the upper limit of normal[31].
Coronary angiogram (A) and multiplanar reconstructed image (B) show severe stenosis in the mid right coronary artery. Cross-sectional images show the proximal reference (C), culprit lesion (D), and distal reference (E). The lesion has positive remodeling (remodeling index 1.28), spotty calcification, and low CT density (16 HU). Red circle indicates area of spotty calcification. CT: computed tomography; HU: Hounsfield units.
- Citation: Sato A. Coronary plaque imaging by coronary computed tomography angiography. World J Radiol 2014; 6(5): 148-159
- URL: https://www.wjgnet.com/1949-8470/full/v6/i5/148.htm
- DOI: https://dx.doi.org/10.4329/wjr.v6.i5.148


