Copyright
©2014 Baishideng Publishing Group Co.
World J Radiol. Apr 28, 2014; 6(4): 106-115
Published online Apr 28, 2014. doi: 10.4329/wjr.v6.i4.106
Published online Apr 28, 2014. doi: 10.4329/wjr.v6.i4.106
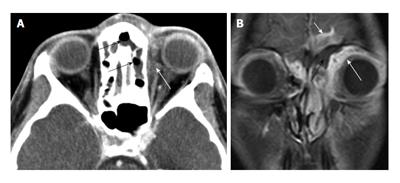
Figure 5 Infectious orbital cellulitis.
A: Axial CT showing layering fluid in the ethmoid sinus and frontal recess on the left (black arrows), and infiltration of the orbital fat (white arrow); B: Coronal T1 fat saturated post-gadolinium MRI demonstrates orbitalfat infiltration (long white arrow). Fluid in the adjacent ethmoid sinus (black arrow) and intracranial extension of the process (short white arrow) are also features that indicate infection rather than orbital inflammatory disease. CT: Computed tomography; MRI: Magnetic resonance imaging.
- Citation: Pakdaman MN, Sepahdari AR, Elkhamary SM. Orbital inflammatory disease: Pictorial review and differential diagnosis. World J Radiol 2014; 6(4): 106-115
- URL: https://www.wjgnet.com/1949-8470/full/v6/i4/106.htm
- DOI: https://dx.doi.org/10.4329/wjr.v6.i4.106


