Copyright
©2014 Baishideng Publishing Group Co.
World J Radiol. Apr 28, 2014; 6(4): 106-115
Published online Apr 28, 2014. doi: 10.4329/wjr.v6.i4.106
Published online Apr 28, 2014. doi: 10.4329/wjr.v6.i4.106
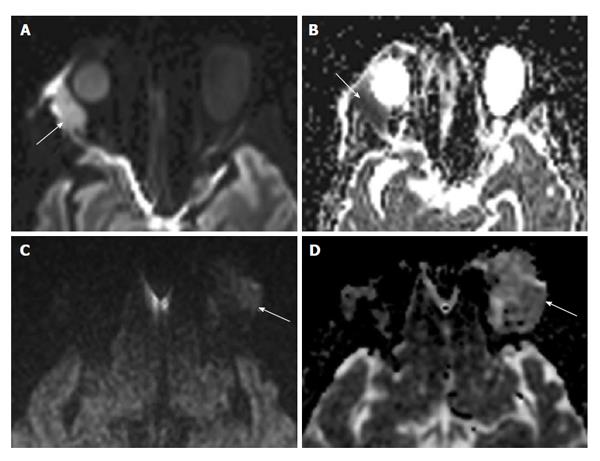
Figure 3 Lacrimal gland lymphoma (A and B) compared to inflammatory dacryoadenitis (C and D).
A: DWI image in a patient with lacrimal gland lymphoma. Note the bright signal intensity (arrow) secondary to inhibition of water movement by the densely packed lymphoma cells; B: The corresponding ADC map of this patient shows an associated reduction in ADC, represented by the dark signal just lateral to the orbit (arrow); C: DWI image in a patient with inflammatory dacryocystadenitis. Note the dark signal compared to the patient with lymphoma (arrow); D: ADC map shows bright signal in the involved lacrimal gland (arrow) as compared to normal brain parenchyma. DWI: Diffusion-weighted imaging; ADC: Apparent diffusion coefficient.
- Citation: Pakdaman MN, Sepahdari AR, Elkhamary SM. Orbital inflammatory disease: Pictorial review and differential diagnosis. World J Radiol 2014; 6(4): 106-115
- URL: https://www.wjgnet.com/1949-8470/full/v6/i4/106.htm
- DOI: https://dx.doi.org/10.4329/wjr.v6.i4.106


