Copyright
©2014 Baishideng Publishing Group Co.
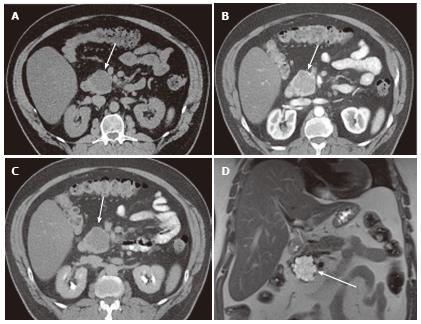
Figure 1 A 65-year-old male with clinically diagnosed typical microcystic serous cystic neoplasm.
A: Unenhanced axial computed tomography (CT) shows a low density mass (arrow) relative to the pancreatic head; B: The pancreatic parenchymal phase of a contrast-enhanced CT shows mild patchy tumor enhancement (arrow); C: The equilibrium phase shows the mass to be low density (arrow); D: Coronal T2-weighted single-shot fat saturation-echo magnetic resonance image clearly demonstrate the mass (arrow) consisting of a cluster of microcysts (honeycomb pattern).
- Citation: Ishigami K, Nishie A, Asayama Y, Ushijima Y, Takayama Y, Fujita N, Takahata S, Ohtsuka T, Ito T, Igarashi H, Ikari S, Metz CM, Honda H. Imaging pitfalls of pancreatic serous cystic neoplasm and its potential mimickers. World J Radiol 2014; 6(3): 36-47
- URL: https://www.wjgnet.com/1949-8470/full/v6/i3/36.htm
- DOI: https://dx.doi.org/10.4329/wjr.v6.i3.36


