Copyright
©2014 Baishideng Publishing Group Co.
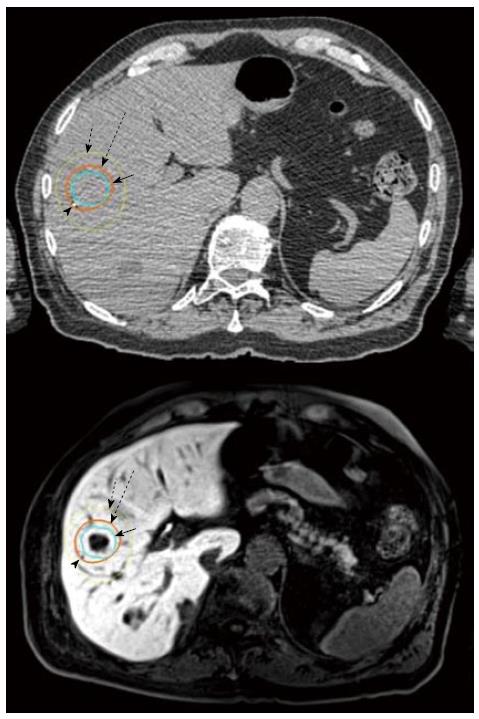
Figure 3 Demonstrating the tight prescription isodose (long broken arrow) around the planning target volume (solid arrow).
The steep dose fall gradient is demonstrated by the 50% isodose curve (short broken arrow) around the prescription isodose. Platinum fiducials showed as arrow head as seen in both computed tomography and magnetic resonance imaging.
- Citation: Nair VJ, Pantarotto JR. Treatment of metastatic liver tumors using stereotactic ablative radiotherapy. World J Radiol 2014; 6(2): 18-25
- URL: https://www.wjgnet.com/1949-8470/full/v6/i2/18.htm
- DOI: https://dx.doi.org/10.4329/wjr.v6.i2.18


