Copyright
©2014 Baishideng Publishing Group Inc.
World J Radiol. Dec 28, 2014; 6(12): 932-936
Published online Dec 28, 2014. doi: 10.4329/wjr.v6.i12.932
Published online Dec 28, 2014. doi: 10.4329/wjr.v6.i12.932
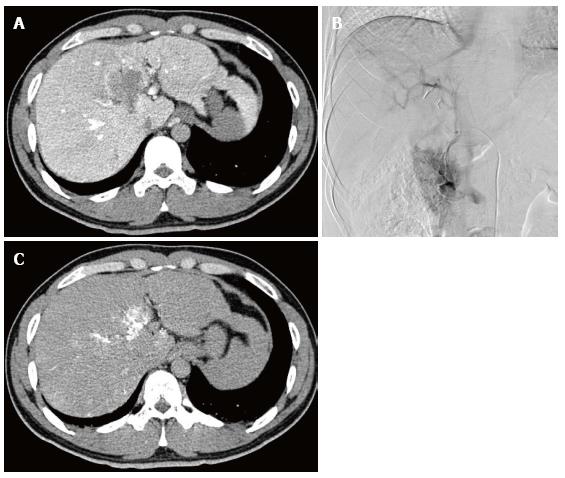
Figure 3 Angiography-assisted computed tomography.
A: Computed tomography (CT) during arterial portography shows a portal venous perfusion defect in S4, which was significantly larger in size than the fatty area shown on CT or magnetic resonance imaging; B: Venous phase of gastroduodenal arteriogram shows an unusual vessel coursing towards the hepatic hilum, representing an aberrant pancreatico-duodenal vein; C: Venous phase of CT during gastroduodenal arteriogram shows that the venous blood from the region of the head of the pancreas directly drains the areas of portal perfusion defect as shown in 3A.
- Citation: Osame A, Mitsufuji T, Kora S, Yoshimitsu K, Morihara D, Kunimoto H. Focal fatty change in the liver that developed after cholecystectomy. World J Radiol 2014; 6(12): 932-936
- URL: https://www.wjgnet.com/1949-8470/full/v6/i12/932.htm
- DOI: https://dx.doi.org/10.4329/wjr.v6.i12.932


