Copyright
©2014 Baishideng Publishing Group Inc.
World J Radiol. Dec 28, 2014; 6(12): 932-936
Published online Dec 28, 2014. doi: 10.4329/wjr.v6.i12.932
Published online Dec 28, 2014. doi: 10.4329/wjr.v6.i12.932
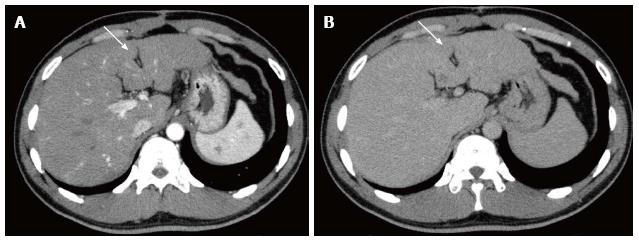
Figure 1 Multidetector-row computed tomography.
A: Arterial phase shows an area of little enhancement (arrow) in segment IV; B: Equilibrium phase shows an area of hypodensity (arrow) as compared with surrounding liver parenchyma.
- Citation: Osame A, Mitsufuji T, Kora S, Yoshimitsu K, Morihara D, Kunimoto H. Focal fatty change in the liver that developed after cholecystectomy. World J Radiol 2014; 6(12): 932-936
- URL: https://www.wjgnet.com/1949-8470/full/v6/i12/932.htm
- DOI: https://dx.doi.org/10.4329/wjr.v6.i12.932


