Copyright
©2014 Baishideng Publishing Group Inc.
World J Radiol. Dec 28, 2014; 6(12): 919-923
Published online Dec 28, 2014. doi: 10.4329/wjr.v6.i12.919
Published online Dec 28, 2014. doi: 10.4329/wjr.v6.i12.919
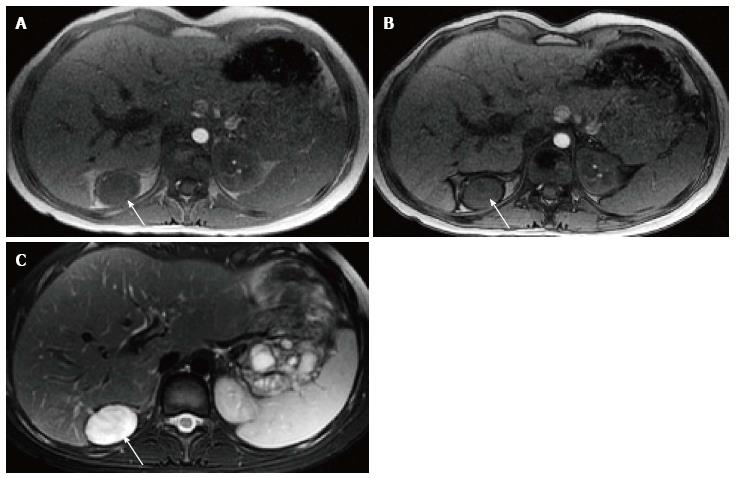
Figure 3 Magnetic resonance imaging in various pulse sequences.
Axial T1-weighted in-phase (A), out-of-phase (B), and axial T2-weighted image (C), showing a right adrenal mass (arrow) which appears isointense skeletal muscles on T1-WI, no signal drop on out-of-phase, compared to in-phase pulse sequences, with markedly increased signal intensity on T2-weighted image.
- Citation: Wassal EY, Habra MA, Vicens R, Rao P, Elsayes KM. Ovarian thecal metaplasia of the adrenal gland in association with Beckwith-Wiedemann syndrome. World J Radiol 2014; 6(12): 919-923
- URL: https://www.wjgnet.com/1949-8470/full/v6/i12/919.htm
- DOI: https://dx.doi.org/10.4329/wjr.v6.i12.919


