Copyright
©2014 Baishideng Publishing Group Inc.
World J Radiol. Dec 28, 2014; 6(12): 919-923
Published online Dec 28, 2014. doi: 10.4329/wjr.v6.i12.919
Published online Dec 28, 2014. doi: 10.4329/wjr.v6.i12.919
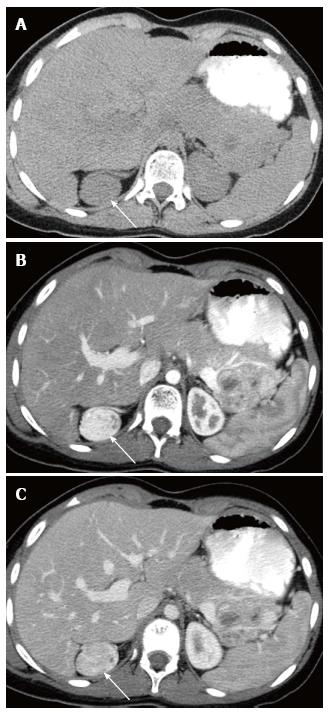
Figure 2 Axial non-contrast computed tomography (A), contrast enhanced computed tomography in arterial (B) and venous phases (C), demonstrating marked enhancement of right adrenal oval mass (attenuation values of 222 and 169 HU respectively) (arrow).
The mass was isodense on non-contrast scan (attenuation value of 39 HU) (arrow).
- Citation: Wassal EY, Habra MA, Vicens R, Rao P, Elsayes KM. Ovarian thecal metaplasia of the adrenal gland in association with Beckwith-Wiedemann syndrome. World J Radiol 2014; 6(12): 919-923
- URL: https://www.wjgnet.com/1949-8470/full/v6/i12/919.htm
- DOI: https://dx.doi.org/10.4329/wjr.v6.i12.919


