Copyright
©2013 Baishideng Publishing Group Co.
World J Radiol. Apr 28, 2013; 5(4): 166-172
Published online Apr 28, 2013. doi: 10.4329/wjr.v5.i4.166
Published online Apr 28, 2013. doi: 10.4329/wjr.v5.i4.166
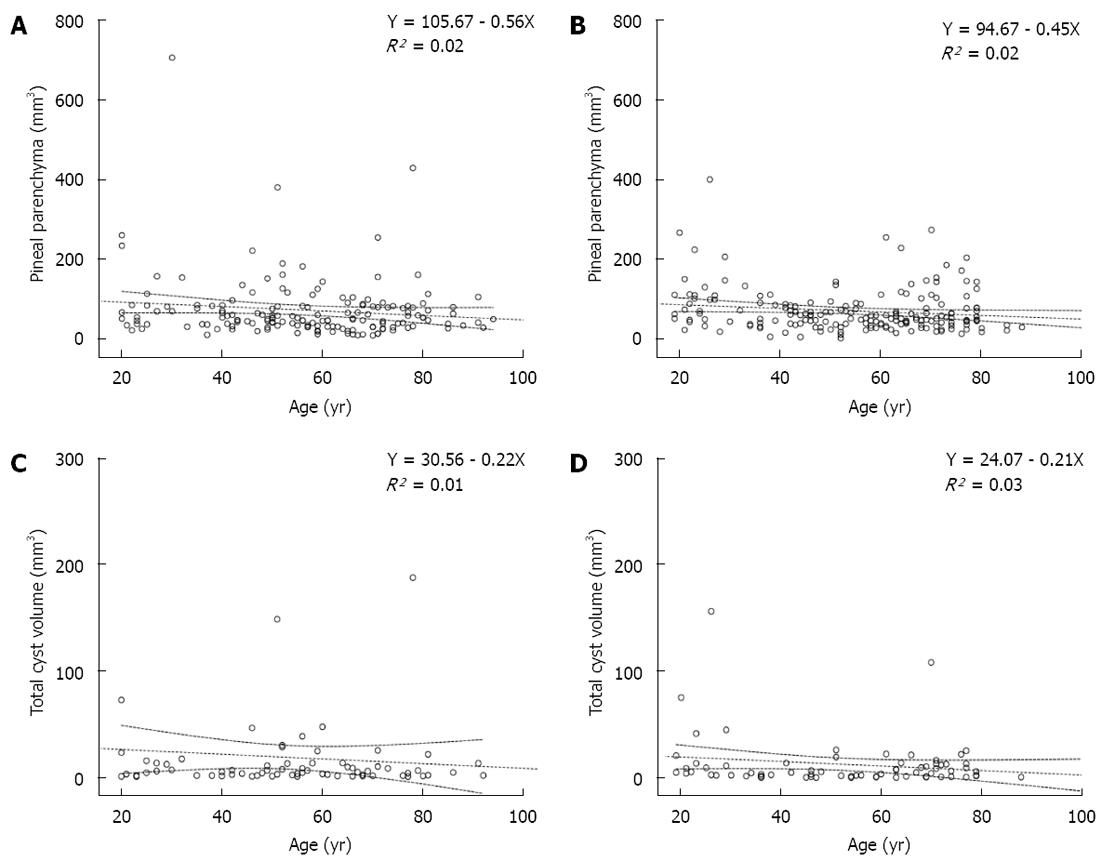
Figure 2 Regression diagram of pineal parenchyma and age.
A, B: In both females (A) and males (B), the mean pineal parenchyma volume decreased slightly with age; C, D: In both females (C) and males (D), the total cystic volume of the pineal gland decreased slightly with age. Dotted line: Linear regression and 95% mean prediction interval.
- Citation: Bumb JM, Brockmann MA, Groden C, Nolte I. Microstructural analysis of pineal volume using trueFISP imaging. World J Radiol 2013; 5(4): 166-172
- URL: https://www.wjgnet.com/1949-8470/full/v5/i4/166.htm
- DOI: https://dx.doi.org/10.4329/wjr.v5.i4.166


