Copyright
©2013 Baishideng Publishing Group Co.
World J Radiol. Apr 28, 2013; 5(4): 156-165
Published online Apr 28, 2013. doi: 10.4329/wjr.v5.i4.156
Published online Apr 28, 2013. doi: 10.4329/wjr.v5.i4.156
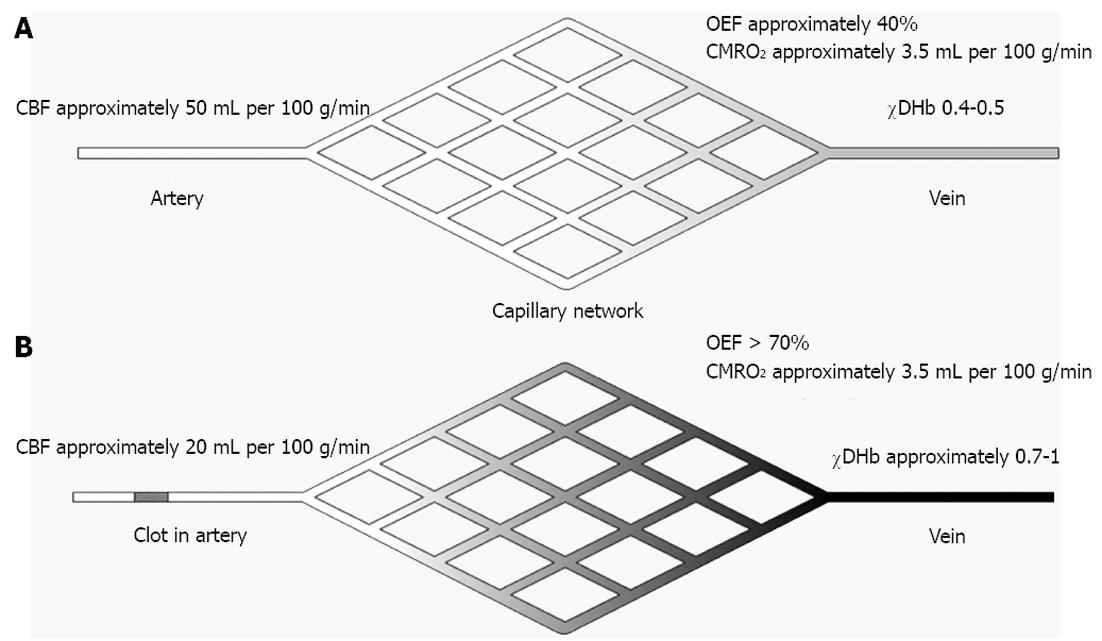
Figure 1 Schematic drawing of brain supplying artery, capillary network and draining vein and the sequence of events leading to an increased visibility of draining veins on T2*w imaging and susceptibility-weighted imaging during acute ischemic stroke.
A: In the normal brain cerebral blood flow (CBF) is approximately 40 mL per 100 g/min to sustain normal brain function. Oxygen extraction fraction (OEF) and cerebral metabolism rate of oxygen (CMRO2) are in the range of approximately 40%-50% and 3.5 mL per 100 g/min respectively. The fraction of deoxyhemoglobin (χDHb) provides the normal appearing venous vessels on T2*w and susceptibility-weighted imaging; B: When the blood supply is interrupted CBF drops to approximately 20 mL per 100 g/min (penumbral threshold) or < 10 mL per 100 g/min (ischemic threshold). In penumbral tissue CMRO2 can be kept stable by an increase of OEF to > 70%. In effect, χDHb rises to its maximum (assuming optimal arterial oxygenation) and draining veins may appear more pronounced and hypointense.
- Citation: Jensen-Kondering U, Böhm R. Asymmetrically hypointense veins on T2*w imaging and susceptibility-weighted imaging in ischemic stroke. World J Radiol 2013; 5(4): 156-165
- URL: https://www.wjgnet.com/1949-8470/full/v5/i4/156.htm
- DOI: https://dx.doi.org/10.4329/wjr.v5.i4.156


