Copyright
©2013 Baishideng.
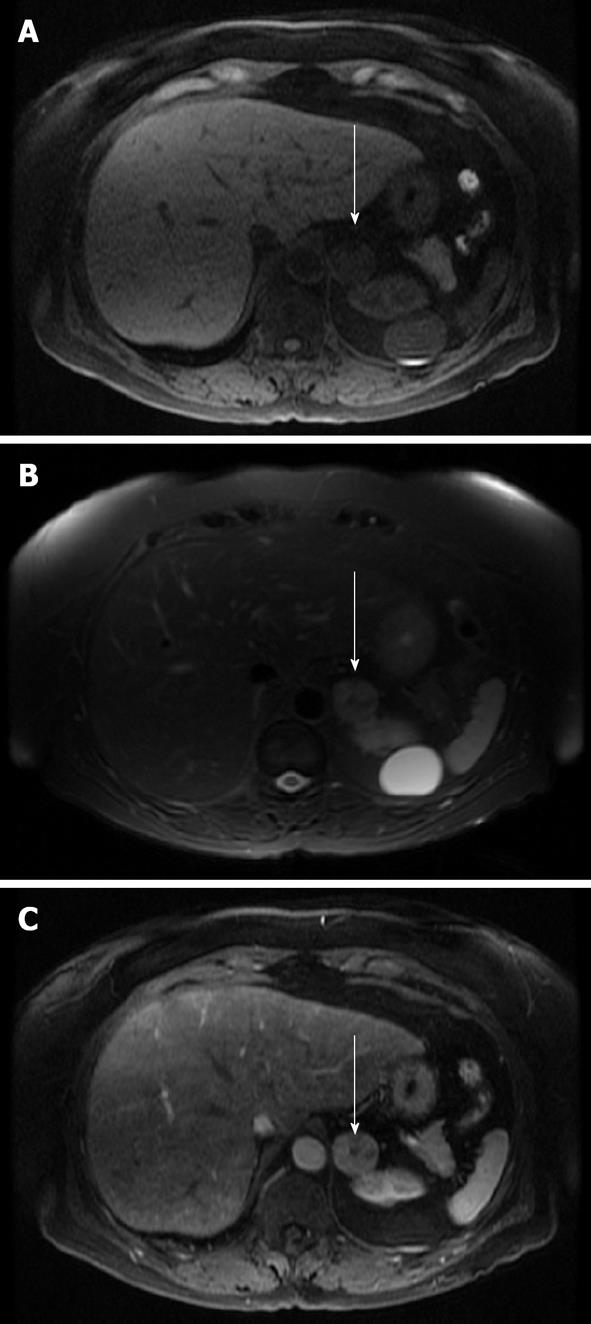
Figure 3 Magnetic resonance imaging axial images of a left adrenal adenoma (arrows).
A: T1 non-contrast image which demonstrates low T1 signal; B: A T2 image which demonstrates intermediate high T2 signal; C: A post-contrast image which demonstrates heterogeneous enhancement.
- Citation: Korivi BR, Elsayes KM. Cross-sectional imaging work-up of adrenal masses. World J Radiol 2013; 5(3): 88-97
- URL: https://www.wjgnet.com/1949-8470/full/v5/i3/88.htm
- DOI: https://dx.doi.org/10.4329/wjr.v5.i3.88


