Copyright
©2013 Baishideng.
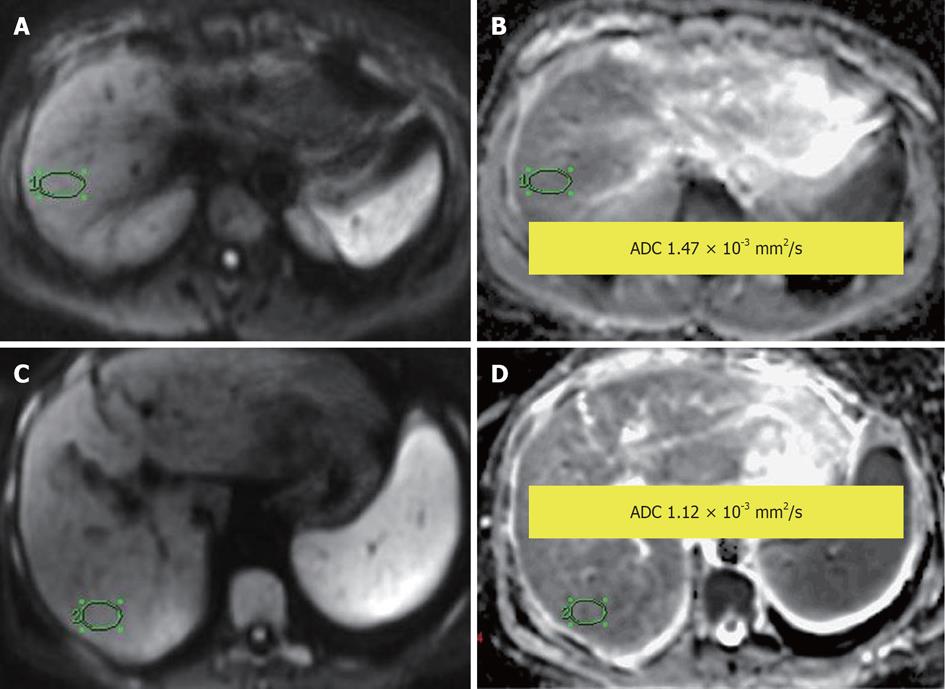
Figure 10 Normal liver parenchyma.
A, B: Diffusion-weighted image (DWI) (A) and apparent diffusion coefficient (ADC) map (B), showing ADC = 1.47 × 10⁻³ mm2/s; Liver cirrhosis: (C) DWI and (D) ADC map, showing ADC = 1.12 × 10⁻³ mm2/s.
- Citation: Morani AC, Elsayes KM, Liu PS, Weadock WJ, Szklaruk J, Dillman JR, Khan A, Chenevert TL, Hussain HK. Abdominal applications of diffusion-weighted magnetic resonance imaging: Where do we stand. World J Radiol 2013; 5(3): 68-80
- URL: https://www.wjgnet.com/1949-8470/full/v5/i3/68.htm
- DOI: https://dx.doi.org/10.4329/wjr.v5.i3.68


