Copyright
©2013 Baishideng Publishing Group Co.
World J Radiol. Dec 28, 2013; 5(12): 472-483
Published online Dec 28, 2013. doi: 10.4329/wjr.v5.i12.472
Published online Dec 28, 2013. doi: 10.4329/wjr.v5.i12.472
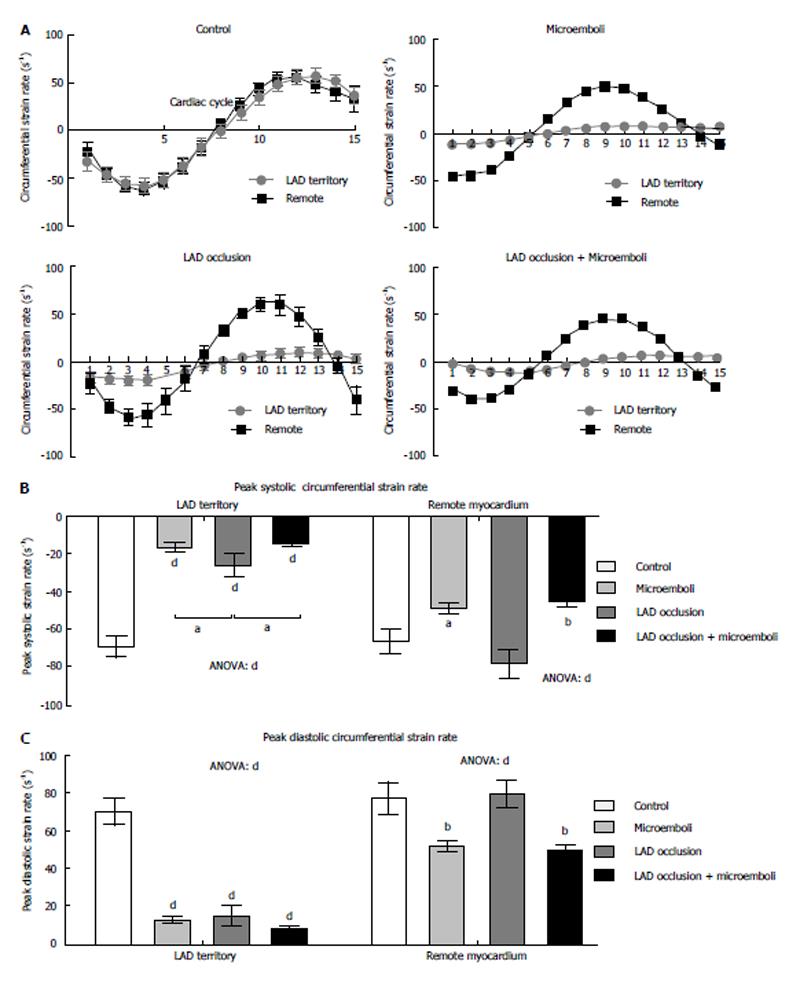
Figure 3 Circumferential strain rate analysis: phasic, peak, and territory time to peak systolic and diastolic strain rate.
A: Circumferential strain rate curves. Data are presented as means ± SEM. In control animals, remote myocardium and location aid device (LAD) territory have identical curves, while remote vs LAD territory in all interventions were significantly different (P < 0.001); B: The LAD territory showed significantly decreased systolic strain rate in LAD territory for all interventions, with microembolized and combined groups significantly less than solely LAD occlusion. Remote myocardium showed only a decrease in microembolized and combined groups; C: The LAD territory demonstrated significantly decreased diastolic strain rate in LAD territory for all interventions. Remote myocardium again showed only significant decrease in microembolized and combined groups. Control vs LAD, aP < 0.05; Control vs Microemboli, bP < 0.01; Control vs ANOVA dP < 0.001.
- Citation: Suhail MS, Wilson MW, Hetts SW, Saeed M. Magnetic resonance imaging characterization of circumferential and longitudinal strain under various coronary interventions in swine. World J Radiol 2013; 5(12): 472-483
- URL: https://www.wjgnet.com/1949-8470/full/v5/i12/472.htm
- DOI: https://dx.doi.org/10.4329/wjr.v5.i12.472


