Copyright
©2013 Baishideng Publishing Group Co.
World J Radiol. Dec 28, 2013; 5(12): 455-459
Published online Dec 28, 2013. doi: 10.4329/wjr.v5.i12.455
Published online Dec 28, 2013. doi: 10.4329/wjr.v5.i12.455
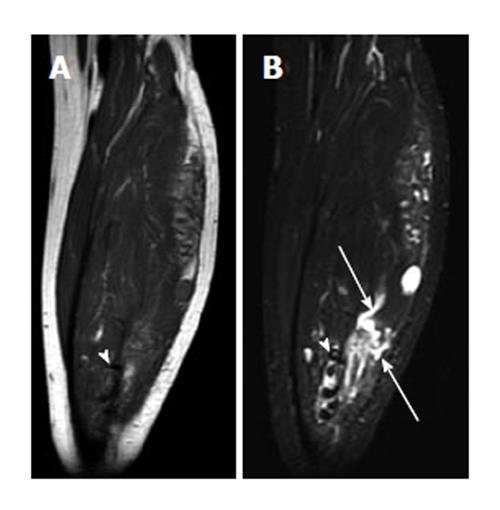
Figure 3 Cavernous hemangioma.
A: Coronal T1-weighted image; B: Fat saturated T2-weighted MR image. The left calf shows a heterogeneous serpiginous high-signal-intensity lesion (arrows) on T2-weighted image, which is caused by dilated slow-flowing vessels with methemoglobin. Some low-signal-intensity pattern (arrowhead) indicates fast-flow blood or hemosiderin or calcification. MR: Magnetic resonance.
- Citation: Chan WP. Magnetic resonance imaging of soft-tissue tumors of the extremities: A practical approach. World J Radiol 2013; 5(12): 455-459
- URL: https://www.wjgnet.com/1949-8470/full/v5/i12/455.htm
- DOI: https://dx.doi.org/10.4329/wjr.v5.i12.455


