Copyright
©2013 Baishideng Publishing Group Co.
World J Radiol. Nov 28, 2013; 5(11): 411-420
Published online Nov 28, 2013. doi: 10.4329/wjr.v5.i11.411
Published online Nov 28, 2013. doi: 10.4329/wjr.v5.i11.411
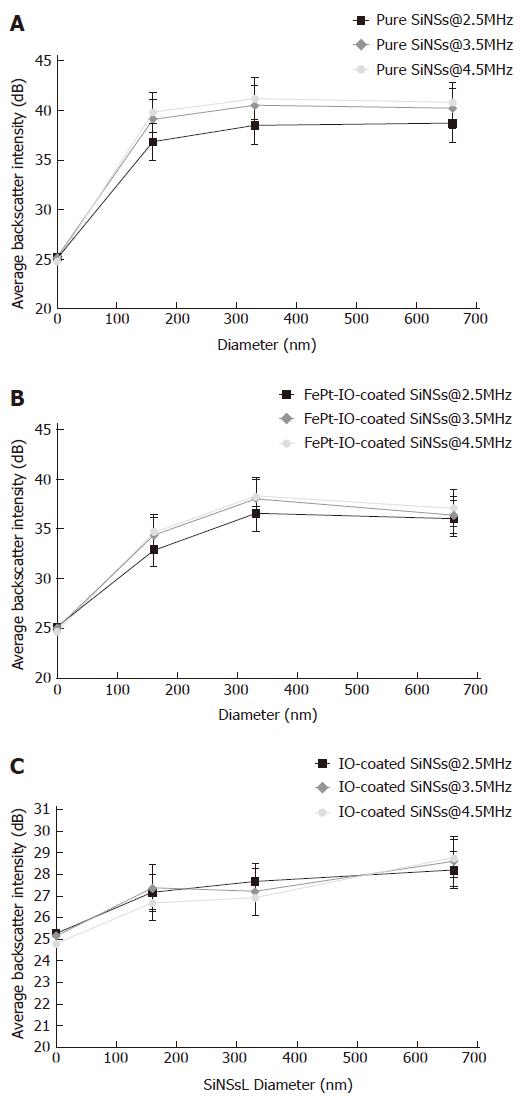
Figure 8 Average backscatter intensity as a function of silica nanospheres diameter for pure silica nanospheres.
A: Pure SiNS; B: FePt-IO coated-SiNS; C: IO-coated SiNSs, at the three investigated ultrasound frequencies. Values of average backscatter intensity are expressed in dB in order to better emphasize lowest values. 0-control point value is obtained from pure agarose gel sample. SiNSs: Silica nanospheres; Pure: Uncoated SiNSs; FePt-IO: Ferrum platinum-iron oxide; IO: Iron oxide.
- Citation: Chiriacò F, Soloperto G, Greco A, Conversano F, Ragusa A, Menichetti L, Casciaro S. Magnetically-coated silica nanospheres for dual-mode imaging at low ultrasound frequency. World J Radiol 2013; 5(11): 411-420
- URL: https://www.wjgnet.com/1949-8470/full/v5/i11/411.htm
- DOI: https://dx.doi.org/10.4329/wjr.v5.i11.411


