Copyright
©2013 Baishideng Publishing Group Co.
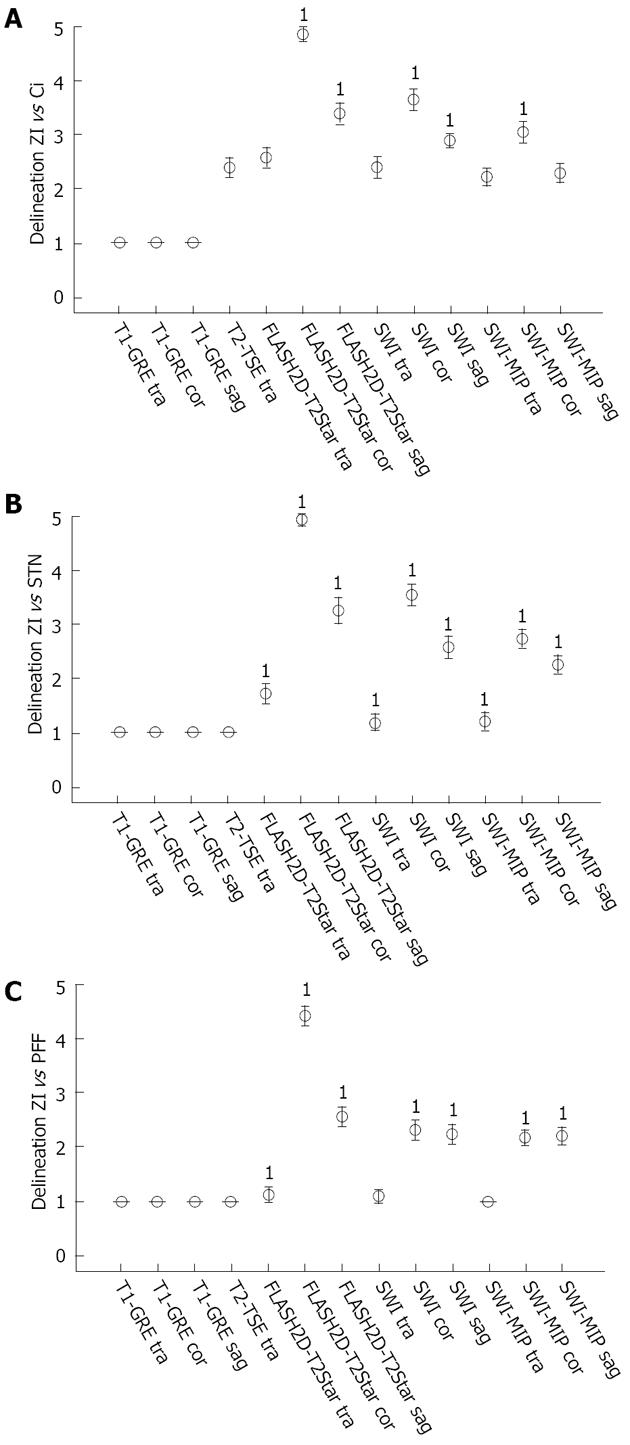
Figure 4 Qualitative ratings.
A: Average delineation of the zona incerta (ZI) vs the internal capsule; B: ZI vs the subthalamic nucleus; C: ZI vs pallidofugal fibres. The table (left) indicates the average delineation and the standard deviation of the mean as well as the inter-rater reliability (κ) with its statistically significance (P value). The diagram (right) demonstrates the average delineation for the ZI, error bars indicate the 95%CI of the mean. Sequences with a statistically significant superior delineation compared to T2-TSE imaging (paired t-test) are denoted (1).
- Citation: Kerl HU, Gerigk L, Brockmann MA, Huck S, Al-Zghloul M, Groden C, Hauser T, Nagel AM, Nölte IS. Imaging for deep brain stimulation: The zona incerta at 7 Tesla. World J Radiol 2013; 5(1): 5-16
- URL: https://www.wjgnet.com/1949-8470/full/v5/i1/5.htm
- DOI: https://dx.doi.org/10.4329/wjr.v5.i1.5


