Copyright
©2012 Baishideng Publishing Group Co.
World J Radiol. Aug 28, 2012; 4(8): 379-386
Published online Aug 28, 2012. doi: 10.4329/wjr.v4.i8.379
Published online Aug 28, 2012. doi: 10.4329/wjr.v4.i8.379
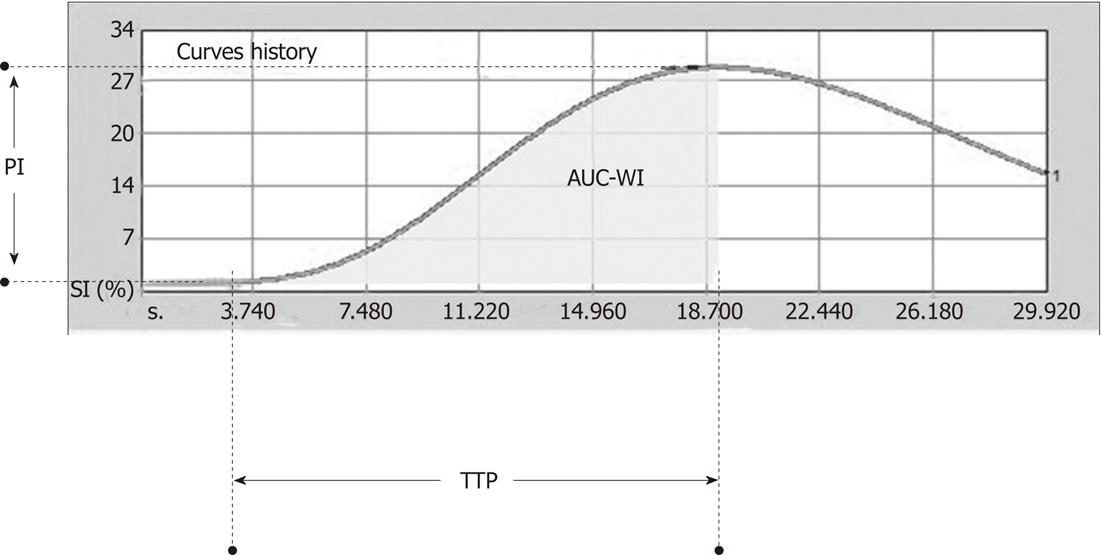
Figure 1 Graph showing the time-intensity curve, which depicts the changes in signal intensity within the selected region of interest during the 30-s acquisition and the three derived parameters: Peak intensity, area under the curve during wash-in phase and time to peak.
PI: Peak intensity; AUC-WI: Area under the curve during wash-in; SI: Signal intensity; TTP: oTime to peak.
- Citation: Moschouris H, Malagari K, Marinis A, Kornezos I, Stamatiou K, Nikas G, Papadaki MG, Gkoutzios P. Hepatocellular carcinoma treated with transarterial chemoembolization: Evaluation with parametric contrast-enhanced ultrasonography. World J Radiol 2012; 4(8): 379-386
- URL: https://www.wjgnet.com/1949-8470/full/v4/i8/379.htm
- DOI: https://dx.doi.org/10.4329/wjr.v4.i8.379


