Copyright
©2012 Baishideng Publishing Group Co.
World J Radiol. Jul 28, 2012; 4(7): 291-301
Published online Jul 28, 2012. doi: 10.4329/wjr.v4.i7.291
Published online Jul 28, 2012. doi: 10.4329/wjr.v4.i7.291
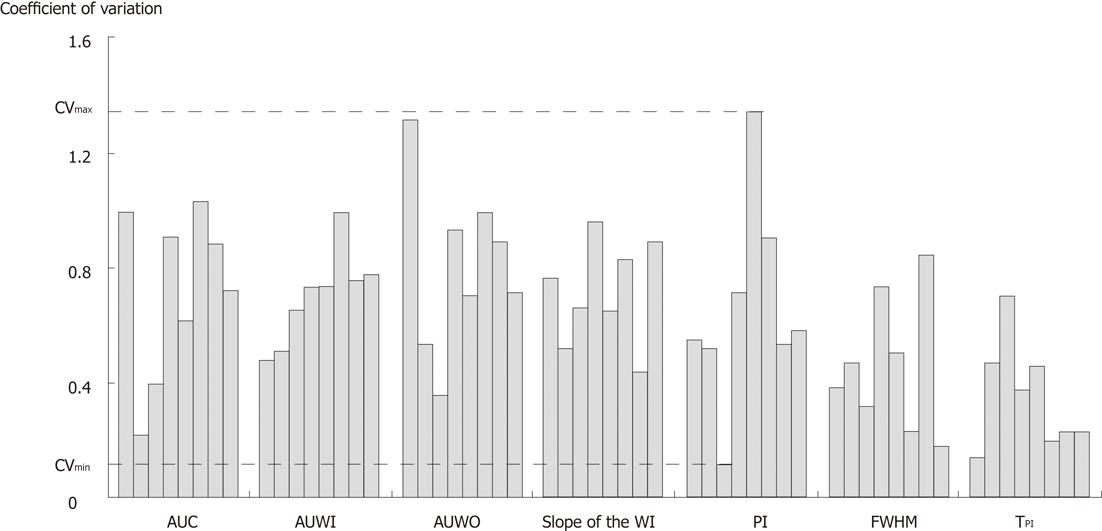
Figure 7 Display of the coefficients of variation, expressed as %, associated with the semi-quantitative microvascularization parameters extracted from the arterial region of interest.
CV: Coefficient of variation; AUC: The area under the curve; WI: The wash-in; AUWI: The area under the wash-in; AUWO: The area under the wash-out; PI: Peak intensity; TPI: Time to peak intensity; FWHM: The full width at half maximum.
- Citation: Gauthier M, Pitre-Champagnat S, Tabarout F, Leguerney I, Polrot M, Lassau N. Impact of the arterial input function on microvascularization parameter measurements using dynamic contrast-enhanced ultrasonography. World J Radiol 2012; 4(7): 291-301
- URL: https://www.wjgnet.com/1949-8470/full/v4/i7/291.htm
- DOI: https://dx.doi.org/10.4329/wjr.v4.i7.291


